


Fantom (FTM) price has rallied more than 10.7% over the last three days to exchange hands at $0.5823 at the time of publication.
It is up 2.55 over the last 24 hours, outperforming the broader crypto market which has 2.12% to $2.34 trillion over the same period.
FTMs daily trading volume has jumped to $180 million, and with a market capitalization of $1.63 billion, it is now at position 53 according to the CoinMarketCap ranking.
Fantom’s performance follows the news that the Fantom Foundation has partnered with Sonic Labs to launch the Sonic Labs Innovator Fund. With this initiative, Fantom’s treasury will contribute up to 200 million FTM to expedite the quick integration of other partners and decentralized apps (dApps) into the Sonic network.
💸 Announcing: Sonic Labs Innovator Fund
We’re committing up to 200,000,000 FTM to accelerate partner migration for the #Sonic launch!
🤝 The fund complements our 100M+ $S airdrop and will attract an influx of innovative dApps to Sonic.
Learn more 👇https://t.co/KnFJMm8DDr pic.twitter.com/zihVJWBw3Q
— Fantom Foundation (@FantomFDN) June 20, 2024
The upcoming funding will give both current Fantom projects and innovative applications native to the new Sonic network unmatched assistance through targeted investments in top-tier infrastructure providers and state-of-the-art on-chain tools.
Before Sonic launches a network ready to handle up to 200 million transactions a day, this is the first of several planned projects that will redefine industry boundaries.
The FTM price jumped immediately following the news as investor interest in the token sparked a recovery. Are bulls strong enough to sustain the recovery?
FTM price needs to flip $0.60 into support to sustain the recovery
At the time of writing, the Fantom price was fighting resistance from the upper boundary of the descending parallel channel at $0.5834.
A daily candlestick close above this level would confirm a bullish breakout from the bearish chart pattern. The next stiff resistance would emerge from the $0.60 supplier congestion level.
A breach of this barrier would suggest the ability of the buyer to sustain the recovery. The next level to watch on the upside will be the 50-day exponential moving average (EMA) at $0.6483 and later the $0.707, where the 100-day and 200-day EMAs appear to converge. Overcoming this resistance would bring the downtrend to an end as FTM rises toward $1.20.
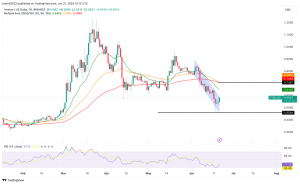

FTM/USD daily chart. Source: TradingView
This optimistic outlook was supported by the upward-facing relative strength index (RSI) away from the overbought region. This suggests that buyers are returning to the scene.
On the downside, failure to rise above the upper boundary of the channel would mean the FTM price remains within the confines of the governing chart pattern. The price could remain within the channel for a few more days, recording lower lows as the lower boundary of the channel at $0.4583 provides the last line of support.


