


Ethereum (ETH), the second-largest cryptocurrency by market cap, is currently experiencing a period of consolidation.ETH’s today’s price movements show the asset hovering around $3,542.53. Despite significant interest from institutional players and the filing of a spot Ethereum ETF by Bitwise Asset Management with the SEC, Ethereum’s price is witnessing a tight trading range, suggesting investor caution at current levels.
ETH Market at a Crossroads
On the daily chart, Ethereum (ETH) appears to be at a critical juncture, trading around $3542.1 after a notable uptrend. The price is now hovering near the Fibonacci retracement level of 0.382, at $3511.9, which often acts as a potential pivot point for the asset’s next move. The 50-day, 100-day, and 200-day Simple Moving Averages (SMAs) are positioned well below the current price, indicating that the overall long-term trend remains bullish.
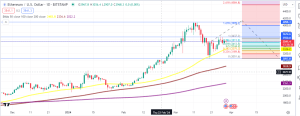

However, the recent pullback to these levels could be an area of interest for traders watching for either a bounce back as a confirmation of the continued uptrend or a breakdown that could signify a deeper correction. The next key resistance level lies near the 0.5 Fibonacci level at $3637.5, which if breached, could pave the way for a move towards the 0.618 level at $3745.3.
Conversely, a break below the 0.382 level might see the price seeking support near the 0.236 level at $3198.8, with further bearish pressure potentially leading to a test of the robust support around $3051.6, aligning with the 200-day SMA.
Ethereum is trading just above the 100-hourly Simple Moving Average after a slight decline from the daily highs of $3,609.71. The coin has been trading within a range since mid-March 2024, with a defined resistance level at $3,680, which ETH bulls are eager to breach to sustain an uptrend towards $4,000.
Ethereum Oscillates Near $3,553: Indicators Signal Uncertain Path Ahead
In the two-hour chart, Ethereum (ETH) is showing a mixed technical outlook. The price is oscillating around $3,553.6, with recent transactions indicating a series of ‘Buy’ signals as the price bounced off the support near the $3,550 level. This is further supported by the Simple Moving Average (SMA) lines, with the 9-period SMA crossing above the 50-period SMA, a classic bullish signal. However, the ‘Sell’ signals on the chart suggest some resistance as the price approaches the $3,600 region.
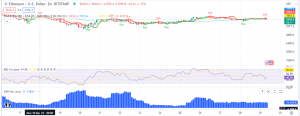
The RSI, hovering near the 50 mark, reflects a neutral momentum, neither particularly overbought nor oversold. This points to a balanced state of buying and selling pressures. Additionally, the volume indicator shows a moderate level of trading activity with about 19.76M in the last 24 hours. This level of activity doesn’t indicate a dominant direction, which corresponds with the current sideways movement seen on the chart.
In the short term, ETH has found substantial resistance at $3,700, while support lies at $3,400, indicating the March 25 lows. A breakout in either direction is expected to dictate the trend for the coming days. The trading volume in the last 24 hours has seen a 35% decrease, standing at $19.76 billion.
The immediate resistance level for Ethereum is near $3,600, with a more substantial barrier at $3,630, aligning with the recent decline from the $3,680 high to the $3,459 low. A push above this could signal a strong bullish phase, potentially propelling Ethereum towards the $3,800 mark and beyond.
Conversely, failure to clear the $3,630 resistance could lead to another downward correction. Initial support lies at the $3,540 level, followed by the major support zones at $3,480 and $3,450. A decisive drop below these supports might trigger a slide towards $3,325 or even $3,250.


