


The Ethereum price is trading at $3,913 as of 3:30 am EST, up 4.5% over the last 24 hours, prompting a debate about whether EHTH could be at the beginning of Ether’s post-ETF approval pump.
According to data from TradingView and CoinMarketCap, the layer 1 token has gained almost 27% over the last seven days to hit an intra-day high of $3,938 on May 27. ETH also reached similar levels just days ago when the United States Securities and Exchange Commission approved spot Ether ETFs on May 23.
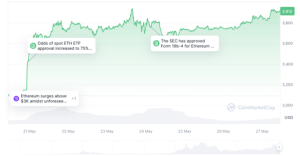

ETH price performance over the last week. Source: CoinMarketCap
Ether’s performance has eclipsed Bitcoin’s 2.6% over the same period.
On May 27, analyst Jelle told their 83,000 X followers that ETH flipped key levels into support after breaking out of a falling wedge, suggesting that “new highs and new all-time highs are next.”
$ETH broke out from the falling wedge, then flipped key areas into support & now pushes for $4,000.
New highs, and new all-time highs are next.
Higher. pic.twitter.com/pjrk8X2FYA
— Jelle (@CryptoJelleNL) May 27, 2024
Fellow analyst and founder of MN Capital Michaël van de Poppe noticed a massive spike in the ETH/BTC pair and a strong weekly bullish divergence from the weekly relative strength index (RSI), “implying that we’re going to have a rotation taking place to altcoins in the coming period.”
“The chances are significant that the 2.5-year bear market is finally over for Ethereum,” van de Poppe added in a May 25 post.
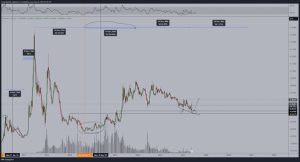

ET/BTC weekly chart. Source: Michaël van de Poppe
Meanwhile, Leon Waidmann, editor and analyst at BTC ECHO said that the TVL of Ethereum layer 2’s has jumped to $46.55 billion “up 13.79% in the last 7 days.”
Waidmann attributed the growth in ETH’s TVL to “the continued adoption of Layer 2 networks and #ETH recent price surge.”
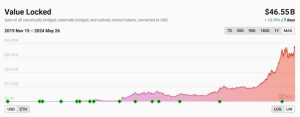

Total value locked in Ethereum layer 2 protocols. Source: Leon Waidmann
Ethereum price readies for a massive upward move
ETH price rallied 24% from a low of $3,053 on May 20, breaching the $3,500 mark to set a swing high at $3,947 on May 23. This was followed by a sharp correction toward $3,600 before rising to the current level of $3,915.
This price action has led to Ether’s escape from a bullish flag on the daily chart (see below). This happened when the price produced a daily candlestick close above the upper boundary of the flag at $3,736 on May 26, confirming a bullish breakout from this chart pattern. This sets ETH on a path toward the much-awaited $4,000 level
A breach of this level would allow the token to climb toward the optimistic target of the governing chart pattern at $46,50, bringing the total gains to 19%.
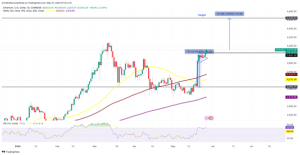

ETH/USD daily chart. Source: TradingView
The positive RSI, which is moving within the overbought region, supported this optimistic outlook. The price strength at 72 suggested that the buyers were still dominating the ETH market.
It remains to be seen when Ethereum’s price will breach its all-time highs, but its uptrend is set to continue after the current correction ends.


