


The price of Ether (ETH) retested its major support levels on Aug. 5; a break below this levels could signal a bearish trend ahead.
According to data from CoinMarketcap, ETH has dropped 20% over the last 24 hour to trade at $2,314. The layer 1 token has underpeformed the wider crypto market which has dropped by 13% over the last 24 hours, wiping out more than $500 billion from the industry to rest at $1.85 trillion at the time of publication.
With this drawdown is the liquidation of more than $1.06 billio leveraged crypto position across the broader crypto market, according to data from Coinglass. The chart below shows that more than $220.76 million long Ether positions have been liquidated on Aug. 5, with the tally increasing at the time of writing.
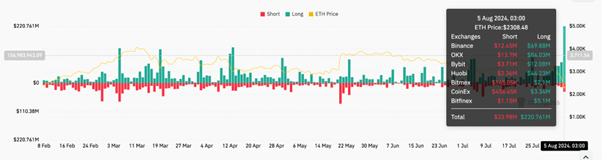

Ethereum liquidations across all exchanges.Source: Coinglass
Also acompanying the flash crash in ETH’s price is the low network activity. According to data from The Block, the number of new addresses on the Ethereum network has hit its lowest level since December 2023, though it remains higher than its value throughout much of 2023.
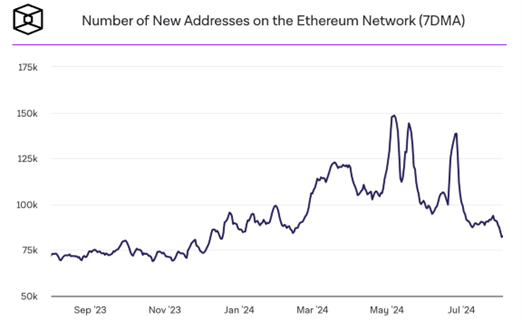

Number of new ETH wallets. Source: The Block
The average number of active addresses and transactions on the Ethereum network have also declined recently as well, hitting nearly six-month lows.
The decline in these numbers following the recent launch of US-based spot Ether exchange-traded funds (ETFs) suggesting that some investors gaining exposure to ETH through those funds, rather than directly owning the tokens.
ETH price analysis
Ethereum price closed below the 200-day EMA at $3,132 on Aug.2 and declined 10% the next day to reach a low of $2,626 on Sunday, Aug. 4 . As of Monday, Aug. 5, Ethereum’s price continues to decline, down 20% over the last 24 hours to exchange hands at $2,314.
If ETH closes below the weekly support at the $2,118 level, it could continue to decline 8.7% to retest its next weekly support at around $1,935.
The Relative Strength Index (RSI) and the Awesome Oscillator on the daily chart have dropped below their neutral levels of 50 and zero, respectively, signaling a bearish trend according to these momentum indicators.
The price strength at 19 in the overbought region suggested that the bears were in full control of the price.
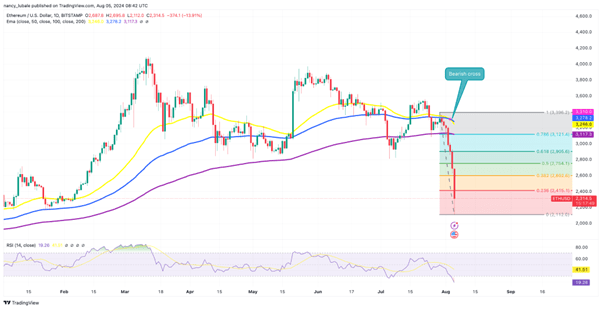

ETH/USD daily chart. Source: TardingView
On the upside, a close above the $2,500 psychological level would change the market structure by forming a higher high on the daily timeframe. Such a scenario might drive a 5% rise in Ethereum’s price to retest the Jan. 12 high of $2,730.


