


Ethereum is the world’s second-largest cryptocurrency by market cap. Today, April 21st, 2024, it is witnessing a resurgence of buying pressure as its price has climbed over 4% in the last 24 hours to trade at $3,172.74 at the time of writing. The smart contract blockchain’s native token has reclaimed the $380 billion market cap level, solidifying its position as the leading altcoin.


ETH Data Chart (CoinMarketCap)
However, ETH has witnessed an upswing today, and it has been faced with substantial sell-offs. Data shows that Ethereum’s 24-hour trading volume stands at $10.2 billion, accounting for a 20.58% drop in the total crypto market volume in the last 24 hours.
ETH Technical Analysis
On the weekly chart, the current weekly candlestick is shaping up to be bullish, having recorded a low of $2,865.71 earlier this week. If the bulls maintain their momentum, the weekly candle could potentially close as a hammer, signaling a potential reversal in trend. The Relative Strength Index (RSI) sits at 59, suggesting that the price might continue its upward trajectory before entering the overbought region.
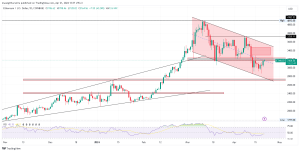
On the daily chart, Ethereum is currently trading within a parallel descending channel. on April 13th,Ethereum’s price broke out massively from the horizontal support zone, around $3,170, falling to a low of $2,850 last week. However, since then, crypto has regained its bullish stance, and today’s price action tests the previously broken support level. Will ETH manage to break through this resistance or face a rejection?
If Ethereum manages to breach this current $3,170 resistance level, it could potentially rally to fill the fair value gap left during its recent bearish run last week and also potentially testing the descending trendline. On the other hand, if the current resistance holds, the price could retrace to test the previous low of $2,850 or even the $2,720 support zone. ETH has today opened at 3156.62 and has so far recorded a high of 3198.46 and a low of 3128.02 so far.

On the 4-hour chart, Ethereum is currently trading at the resistance level. The next immediate resistance lies at the $3,280 zone, and if the bulls can overcome this level, the fair value gap above could attract further buying pressure. Conversely, if the price faces rejection at the current levels, the next support to watch is the recent low of $2,850.
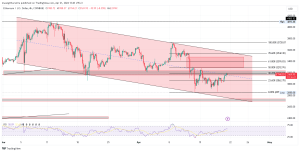
ETHUSD 4-hour Chart (TradingView)
The FIB Retracement is currently at the 38% zone and at the support level. Can it retrace higher to test the 50% and 61% Fibonacci retracement levels? An RSI Reading of 58 may help it retrace higher before dropping further so as to fill gaps above the current support and also potentially test the descending channel trendline.


