


Ethereum is the second-largest cryptocurrency by market capitalization and has been on a remarkably bullish run since the beginning of 2024, hitting a new high of $4,093.88 last week, the highest price level it has recorded after the crypto market downturn since December 2021.
However, according to market data in CoinMarketCap, ETH closed the previous weekly candlestick at $3,641.02, marking a massive 11.21% drop over the past seven days as of writing.
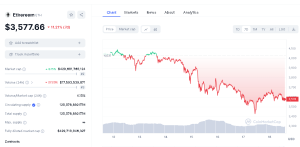

ETH Data Chart (Source: CoinMarketCap)
In the last 24 hours, ETH has gained 0.71%, currently trading at $3,605.23 as of writing. The market cap of Ethereum stands at over $432 Billion, a 0.93% increase from the previous day, as its 24-hour trading volume reads at $17.6 Billion. Also, the volume-to-market-cap ratio for Ethereum is 4.10%, indicating a healthy level of liquidity.
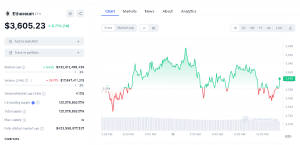

Eth 1-Day Data Chart ( Source: CoinMarketCap)
The circulating supply and total supply of Ethereum remain unchanged at 120,078,892 ETH.
ETH Weekly Technical Analysis
As a new week starts, investors and traders alike are keeping a close eye on Ethereum’s price behavior, particularly after testing such a significant resistance zone that has not been breached in over three years. The immediate support levels to watch are the previous week’s low at around $3,415 and the ascending trendline that has underpinned the recent rally.
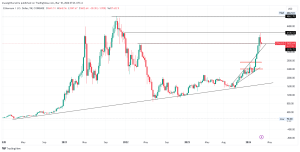

ETHUSD 1-Week Price Chart (Source: TradingView)
On the other hand, if the $4,093 resistance is decisively broken, Ethereum could potentially embark on a rally towards the next resistance level at $4,862.78. The cryptocurrency’s market capitalization currently stands at an impressive $433 Billion and above as of writing, solidifying its position as the second-largest digital asset.
From a technical analysis perspective, Ethereum’s weekly chart presents an intriguing picture. The Relative Strength Index (RSI) indicator currently reads 73.69, indicating that the asset is in overbought territory and potentially due for a correction or consolidation. Furthermore, the Moving Average Convergence Divergence (MACD) indicator stands at 134.17, suggesting that the bullish momentum remains strong.
ETHUSD 1-Week Price Chart (Source: TradingView)
ETH Daily Technical Analysis
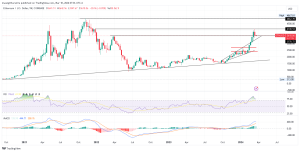
Ethereum’s daily chart shows a bearish trend since hitting the high of $4,093.88 the previous week. The price has been on a downward trajectory, showing no signs of reversal. A crucial support level lies at the immediate ascending trendline, which was recently retested before the rally to the high. If this support is breached, Ethereum could drop further to test the next support level around the $2,723 zone.
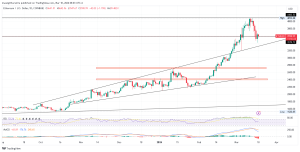
ETHUSD 1-Day Price Chart (Source: TradingView)
Today’s daily candlestick opened at $3,641.51 and has traded within a range of $3,642.56 on the upside and $3,547.67 on the downside, indicating a potentially indecisive trading session.
The Relative Strength Index (RSI) currently stands at 53.24, suggesting a relatively neutral market sentiment. However, the Moving Average Convergence Divergence (MACD) indicator reads -68.89, indicating that bearish momentum may be gaining strength.
As Ethereum navigates these crucial support levels, traders keep a close eye on the price action for potential breakouts or further downside momentum.


