


The Ethereum price is exchanging hands at $2,881 as of 5:30 a.m. EST, down 6.67% over the last 24 hours.
ETH experienced a 14.5% drop from a high of $3,286 on April 29 to an intraday low of $2,817 during the early Asian trading hours on May 1.
The flash downswing resulted in liquidations of more than $115,510 worth of ETH futures, which were leveraged bets on the price decrease, according to data from Coinglass. Of these liquidations, $97.4 million were leveraged ETH long positions, which were caught off guard on Ethereum’s drop below $1000.
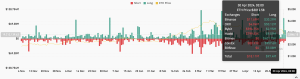

Total ETH liquidations. Source: Coinglass
The May 1 marketwide sell-off appears to be triggered by the hawkish financial policy stance expected from the Federal Reserve later today. In addition, the poor performance of the spot Ethereum ETFs on their first day of trading in Hong Kong and the four-month jail sentence handed to Binace former CEO and founder Changpeng zhao in the United States.
Can ETH reclaim the $3,000 Level?
The cause of the 14% flash crash over the last few days does not necessarily invalidate Ether’s bull run or make gains above the $2,500 resistance realized after the October 2023 bull run.
For now, the bulls have to focus on reclaiming the $3,000 level. The long lower wick on Tuesday’s candlestick suggests that the buyers are aggressively defending teh $2,800 support level.
Increased buying from the current level could see ETH scale higher with the first target being a return to $3,000, embraced by the 100-day exponential moving average (EMA) and later the 50-day EMA around $3,236. If this happens, it will indicate the ability of the buyers to defend support from the 200-day EMA just below $2,800.
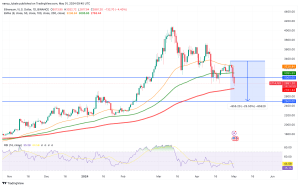

ETH/USD Daily Chart
However, the technical outlook suggested that the ETH price was more inclined to drop than continue rising. Supporting this technical outlook was the downward-facing moving averages.
Ether also faced stiff resistance on the upside. These were areas defined by the $3,000 psychological level, the 100-day EMA $3,095, and the 50-day EMA at $3,236.
The relative strength index (RSI) was also facing downwards, a suggestion that bears were dominating the market.
As such, failure to hold the support at $2,800 would imply the inability of the buyers to initiate a recovery. The bears would then pull the price below the 200-day EMA at $2,763 with the downside probably being capped around the $2,500 buyer congestion zone.


