


Ethereum’s price has taken a rough beating over the past several weeks, plunging over 16% in the last 30 days to trade below the key $3,000 level. The world’s second-largest crypto by market cap was last trading at $2,974, down a sharp 5.76% over the past 24 hours and 8.3% in the last seven days as of writing.
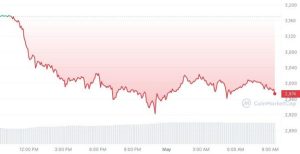

ETH Price Chart: CoinMarketCap
The sell-off comes despite high hopes for the launch of the first spot Bitcoin and Ethereum exchange-traded funds (ETFs) in Hong Kong on April 30th. While the listings marked a significant milestone for retail crypto investors to trade these assets at real-time prices, early trading volumes have disappointed.
On the first day, the six new ETFs tracking Bitcoin and Ether rallied just $12.7 million in total trading volume. Bitcoin ETFs accounted for $9.7 million, while Ether funds contributed a mere $3 million. Industry expectations had set the bar much higher at over $100 million in first-day volume.
Hong Kong #Bitcoin and #Ethereum ETF launches didn’t fully live up to their hype IMO. We don’t have assets data yet but based on Bloomberg data i see about $12.8 million it total $ Volume for their first day. pic.twitter.com/zS1nyerj1k
— James Seyffart (@JSeyff) April 30, 2024
Ethereum’s $364 billion market cap still makes it the second-largest cryptocurrency after Bitcoin. Its total circulating supply stands at 122,057,445 ETH. Over the last 24 hours, its trading volume across all exchanges reads at $18 billion, ranking third overall.
ETH Technical Analysis
On the weekly chart, Ethereum has been trapped in a descending channel pattern. On April 13th, the price broke down massively from horizontal support at $3,170, hitting a low of $2,850. This week’s candlestick is heavily bearish.
On the daily timeframe, ETH is still showing bearish momentum, opening at $3,011 today and trading as low as $2,956 while continuing to make new intraday lows. If bears remain in control, the price could retest $2,850 or below to the descending channel support.
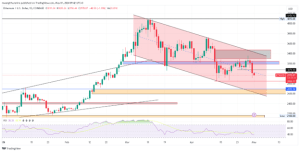

ETHUSD Daily Chart: TradingView
At the descending channel support, there is a confluence of double support. First, the normal descending channel support and second, there is a demand zone that confluence to act as a magnet pulling prices lower and also acting as strong support against price dropping further. Also, the RSI reading of 38 indicates almost oversold conditions that could presage a bounce from support around $2,690 mark of the demand zone.
On the 4-hour chart, a resistance level has formed at $3,075 after the price broke down through it while it was support, leaving a fair value gap that could get filled on a relief rally. The next downside targets are the $2,850 low, the double support of the descending channel support and the $2,690 demand zone.
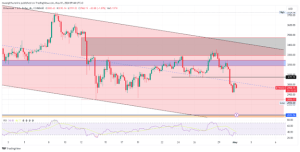
ETHUSD 4-Hour Chart: TradingView
The key question is, can Ethereum find buying pressure and turn bullish after hitting this confluence support around $2,690?


