


The bears are resuming the downtrend in Bitcoin on Thursday, as the big crypto trades 1% lower on the day. The second largest cryptocurrency by market capitalization, Ether, is flashing green, up 1.20% over the last 24 hours.
Other top-cap cryptos, such as BNB Chain’s BNB and Cardano (ADA), were also in the green, up 1.25% and 2.75%, respectively, over the last 24 hours.
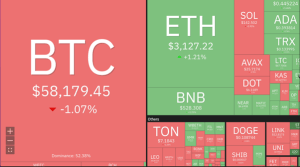

24-hour performance of top cryptocurrencies. Source: Coin360
Others, such as Avalanche, Solana and Polkadot, were turning down, reflecting the general sentiment in the wider crypto market. The total crypto market valuation was down 24% over the last 24 hours to rest at $2.14 trillion.
Could altcoin start a rebound in the next few days and initiate an altcoin season? Let’s analyze the charts of the top 2 altcoins to find out.
Ethereum price analysis
The ETH price nurtures a V-shaped recovery chart pattern on the daily chart, as shown below. The appearance of four consecutive candlesticks on the daily chart shows that bulls are taking control of the price.
The 200-day exponential moving average (EMA) at $3,119 is acting as immediate resistance for the token.
The relative strength index (RSI) is rising toward the 50-point mark, suggesting that the buyers were returning to the scene. As such, increased buying from the current levels will see the price rise to confront resistance from the 200-day EMA and later rise toward the $3,100, embraced by both the 100-day and 50-day EMAs.
Higher than that, the price of the smart contracts token could rise to confront resistance from the psychological level at $3,500. A daily candlestick close above this level could see Ethereum rise to hit the neckline of the prevailing chart pattern at $3,974. Such a move would bring the total gains to 27%.
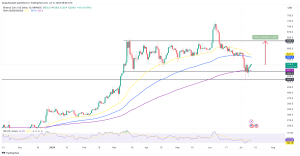

ETH/USD daily chart. Source: TradingView
On the downside, the 50-day and the 100-day were about to send a sell signal on the daily chart. This may come in the form of a bearish cross that may take place once the 50-day EMA crosses below the 100-day EMA.
If this happens, the sellers may pull Ether’s price lower, with the $3,000 psychological providing the first line of defense. Losing this support would see ETH drop to the chart’s bottom at $2,800 or lower to the $2,000 major support level.
BNB price analysis
Sellers pulled the BNB price below the $495 support on July 8, but the bulls successfully defended the $460 support.
All the major moving averages faced downward and the RSI was still positioned in the negative region. The price strength at 42 suggested that the market conditions still favored the downside.
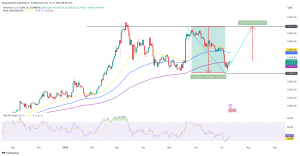

BNB/USD daily chart. Source: TradingView
BNB’s price could reach the 100-day EMA at $561, which is likely to act as a stiff resistance. If the price turns down from the 100-day EMA, the bears will attempt to sink the BNB price below the 200-day EMA at $500 and later breach the major support level at $495. Losing this support would see the bulls retreat toward the $465 support floor.
Contrarily, a break and close above the 100-day EMA will signal that the corrective phase may be over. The pair could rise to the 50-day SMA ($5970) and subsequently to the stiff resistance at $635. This would represent a 19% uptick from the current price.


