


The Ethereum price was trading at $3,792 as of 4:30 am EST, up 2% over the last 24 hours. Ether’s price has rallied more than 25% over the last three days, reaching a two-month high of $3,840 on increasing expectations of spot Ethereum ETFs being approved this week in the USA.
ETH’s performance came after Bloomberg’s senior ETF analysts, James Seffart and Eric Balchunas increased their approval odds to 75%, down from 75%.
Via @coindesk fyi https://t.co/2PNBCkr90q pic.twitter.com/ElI4rIp8Ho
— Eric Balchunas (@EricBalchunas) May 20, 2024
The latest developments concerning this issue involve at least 5 of the spot Ethereum ETF applicants submitting Amended 19b-4’s on May 22, as reported by Eric Balchunas.
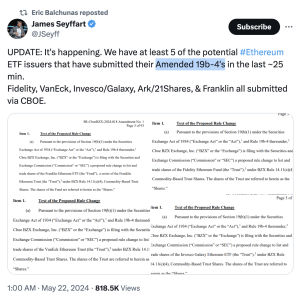

Source: Eric Balchunas
In a May 23 post on X, Balchunas said that he expects the SEC to deliver its decision at 4:00 pm New Jersey time.
“My best guess is we hear from the SEC around 4pm tomorrow. For spot btc they dropped it at 3:45pm, some others in past were slightly after 4pm. Anything poss tho.”
On-chain data shows that as the expectations of the spot Ethereum ETF approval come closer, traders are placing bigger bets on ETH with most of them being caught off-guard following the sharp spike on May 20.
According to a CryptoQuant report published on May 22, the liquidation of short Ethereum positions in the perpetual futures market spiked to the largest hourly volume so far 2024. The total short positions liquidated amounted to 9,300 ETH, causing a short squeeze in the futures markets.
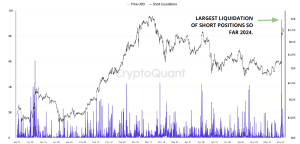

Ethereum short liquidations on all exchanges. Source: CryptoQuant
Data from Coinglass shows that the ETH total open interest is currently standing at an all-time high of $15.4 billion. The total funding rate aggregated by Ethereum increased from 0.0055% on May 19 to 0.0270% on May 21.
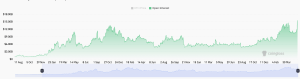

ETH Open Interest. Source: Coinglass
The indicator shows that the number of traders betting on a further ETH price surge has risen, and due to high price volatility, a series of large liquidations would be expected.
Ethereum price analysis: The next levels to watch
The ETH price turned away from a 26-month high at $4,000 on March 14, dropping more than 31% to set a swing low at $2,814 on May 1.
Ether’s price displayed bullishness over the last few days as shown on the daily chart below, with the $3,900 supplier congestion zone posing immediate resistance. Bulls will now look to flip this level into support with the key levels to watch on the upside being the $4,000 psychological level and later the all-time high at $4,891.
Breaching this level will clear the way toward the much-coveted $5,000. This would represent a 30% uptick from the current level.
All the major moving averages were trailing the price and the position of the relative strength index at 71 in the overbought region validated the dominance of the buyers in the market.
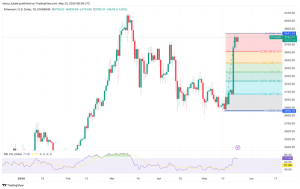

ETH/USD daily chart. Source: TradingView
On the other hand, the overbought conditions displayed by the RSI suggested that the ETH price could soon turn down from the current levels as buyer exhaustion and profit-booking kick in.
The key levels to watch on the downside are the $3,600 to $3,450 demand zone, where 23.6% and 38.2% Fibonacci retracement levels sit.
Other lines of defense could emerge from the 61.8% Fibonacci retracement level at $3,236 and the psychological level at $3,000. Other lines of support can be found at the 78.6% retracement and later the $2,858 swing low. Such a move would undo all the recent gains and invalidate the bullish thesis.


