


Ethereum is the second largest crypto asset by market cap and has faced huge regulatory pressure. On Thursday, April 25, Consensys, the company behind the popular MetaMask wallet, filed a lawsuit against the U.S. Securities and Exchange Commission (SEC). The lawsuit accuses the SEC and its commissioners, including Chair Gary Gensler, of unlawfully asserting authority over Ethereum.
BREAKING: SEC SUED OVER ETHEREUM!
Crypto firm @Consensys is suing the US SEC over Ethereum regulation, asks court to state that the $ETH token is not a security. pic.twitter.com/dgwVDKf5Oy
— Altcoin Daily (@AltcoinDailyio) April 25, 2024
The legal battle could potentially determine whether Ethereum is classified as a security or a commodity, a long-standing debate within the crypto industry. The outcome of this case may have far-reaching implications for the regulatory landscape surrounding Ethereum and other cryptocurrencies.
On the price front today, April 26th, Ethereum has experienced mixed performance in recent days. Despite a slight 0.68% drop in the last 24 hours, Ethereum has recorded a 3.85% gain in the past seven days. At the time of writing, Ethereum is trading at $3,132.45, with a market cap of $38.5 billion, ranking as the second-largest digital asset after BTC.
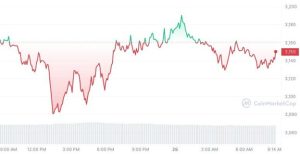

ETH Price Chart (CoinMarketCap)
ETH Technical Analysis
Ethereum’s price action has been confined within a descending channel in the midst of an uptrend, also often seen as a bullish flag. On April 13, the price experienced a significant bearish breakdown, dropping from the horizontal support level of $3,200 to a low of $2,850.
The last three consecutive weekly candles have closed as bearish candlesticks. However, last week saw bulls push prices higher, away from the $2,850 zone, closing the weekly candle as a long-legged doji, signaling the potential for further upside momentum.
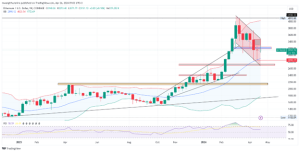

ETHUSD Weekly Chart (TradingView)
The weekly Relative Strength Index (RSI) currently stands at 58.59, indicating recent buying pressure and suggesting that Ethereum might see additional upward movements before approaching overbought territory. Also, there is wide Bollinger Bands that suggest increased volatility in the ETH market.
ETH Daily Technical Analysis
Ethereum is trading below the resistance zone on the daiky time frame, despite recording slight bullish activity yesterday to closing above the open. If prices manage to break through this current resistance and trade upwards, ETH is most likely to trade upwards, filling a fair value gap left during the massive bear run on April 12 and potentially testing the bullish flag trendline resistance.
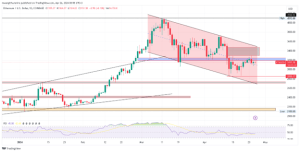
ETHUSD Daily Chart (TradingView)
On the other hand, if bears regain extra control pushing price away from the resistance zone, prices could drop back to the recent low of $2,850. Today, Ethereum has opened at $3,155.27, and has recorded a high of $3,164.37 and a low of $3,124.02 so far. The RSI of 45 suggests ample room for a potential buying spree before reaching overbought conditions, should bulls shift the market dynamics.
4-hour Technical Analysis
Ethereum has established a resistance level around the $3,280 zone. Above this level, there is a significant fair value gap yet to be filled if bulls can break through the resistance. However, if bears continue their run, the price could drop back to the recent low of $2,850.
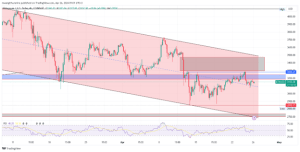
ETHUSD 4-Hour Chart (TradingView)
As the regulatory landscape evolves and market participants closely watch Ethereum’s price action, the question remains. Will Ethereum experience a bullish or bearish momentum in the near future amid these regulatory issues and significant whale accumulations?


