


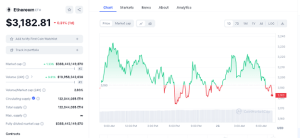
Ethereum (ETH) is the second largest cryptocurrency by market cap and is currently trading at $3,182.81, down 0.31% in the last 24 hours. Despite the slight dip, ETH has recorded a 4.53% gain over the past week and the market appears optimistic about its prospects, with a market cap of over $388 billion and a 24-hour trading volume of $11 billion, an 8.81% increase in the last 24 hours.

ETH Data Chart (CoinMarketCap)
The anticipation surrounding Ethereum’s potential rally is fueled by the recent approval of spot Bitcoin and Ethereum ETF applications in Hong Kong earlier last week, on April 15th, 2024. A spot Ethereum ETF could be just a month away as the deadline for one of the spot ETH ETF applications is May 23., investors are eagerly awaiting a significant catalyst that could propel ETH’s comeback.
In 34 days, the Spot #Ethereum ETF will launch.
Are your bags prepared? pic.twitter.com/mySw2iHO90
— Mister Crypto (@misterrcrypto) April 22, 2024
ETH Technical Analysis
On the technical bit and on the weekly, Ethereum has been trapped in a descending ranging channel on the general trend of the chart. However, the current weekly candlestick is bullish after recording a low of $3129.68 this week and currently trading at $3182.81. The last three consecutive weekly candles have closed as bearish candlesticks, but last week, buyers entered the market, pushing prices above and closing the weekly candle as a long-legged doji. The RSI at 59 indicates a recent buying spree, suggesting potential for slight upside movements before reaching the overbought region.
ETH Daily Technical Analysis
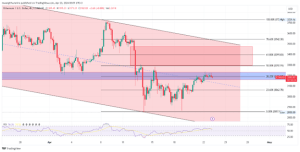
On the daily chart, Ethereum is currently within a parallel descending channel. On April 13th, the price broke down massively from the horizontal support at the $3190 zone and traded to a low of $2850 last week. However, since then, it has been recovering, and today, it is testing the broken-down support at the $3190 zone.

ETHUSD Daily Price Chart (TradingView)
If it breaks this resistance, it could rally to fill a fair value gap left a few days ago during its massive bear run on April 12th and potentially test the descending trendline. On the other hand, if it faces rejection at this current resistance, it could fall to test the last low of $2850 or below to the $2720 support zone. The daily RSI of 46 shows ample room for a buying spree before reaching the overbought region.
On Fibonacci retracement levels, the price is currently trading at a 38% retracement level and might test the 61% mark retracement, potentially filling the imbalance above if the $3190 resistance zone is breached.
ETH 4-Hour Technical Analysis
On the 4-hour chart, the price is currently trading at the resistance level. The next immediate resistance is the $3280 zone and above it is the fair value gap that might attract prices more to the upside. The next support is the last low of $2850. Market participants will closely monitor the activity at this crucial resistance level to gauge Ethereum’s potential for a breakout or rejection.
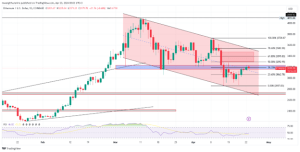
ETHUSD 4-Hour Chart (TradingView)
As the countdown to the launch of the spot Ethereum ETF continues, traders and investors are keeping a close eye on Ethereum’s price movements, with the potential for a significant rally fueled by this highly anticipated event.


