


ETH price analysis shows Ethereum encountering significant volatility as it navigates through the current market landscape. Today’s price movements indicate a struggle for Ethereum as it contends with both short-term and long-term technical indicators. Traders are closely monitoring ETH’s performance amidst fluctuations in trading volume and key support and resistance levels.
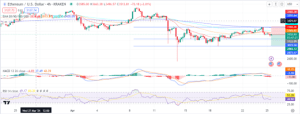
In the past 24 hours, Ethereum’s price has experienced notable fluctuations, with ETH trading around $3,250. The cryptocurrency faces resistance at the $3,280 level, struggling to maintain bullish momentum. Despite attempts to break above key resistance levels, ETH has encountered rejection, signaling a potential shift toward a bearish trend.
Convergence of EMAs and Volatility
The convergence of the 26 and 50 EMAs has created a tight trading range for Ethereum, leading to increased volatility as the asset battles between these two averages. This convergence often serves as a significant technical signal, influencing trader sentiment and market dynamics. Furthermore, declining trading volume suggests a potential reversal in the current trend, adding to market uncertainty.

If Ethereum manages to consolidate above the $3,132.80 support level, it could resume its bullish momentum toward the next target of $3,360.31. However, failure to maintain support may result in further bearish correction, with ETH potentially retesting lower support levels around $3,000. Notably, the $3,000 level often plays a psychological role in influencing trader sentiment.
ETH is currently trading below $3,200 and the 100-hourly Simple Moving Average, facing immediate resistance near the $3,180 level. The next major resistance lies at $3,200, followed by $3,220 and $3,250. Conversely, initial support on the downside is near $3,120, with the main support at $3,030. A clear break below $3,030 could intensify selling pressure, potentially driving ETH towards $2,850.
The Hourly MACD for ETH/USD indicates waning momentum in the bearish zone, while the hourly RSI is below the 50 level, signaling negative sentiment among traders. These technical indicators underscore the challenging environment for Ethereum, with downward pressure likely to persist in the near term.


