


Polkadot (DOT), one of the prominent players in the blockchain sector, has seen its price take a noteworthy route in recent trading sessions. As of the latest data, DOT is trading at $9.36, reflecting a 2.94% decrease over the past 24 hours. This price action comes after a notable dip, with DOT’s price having tumbled from a high of $11.84 to lower levels, causing concerns about the asset’s immediate future among holders.
DOT Technical Analysis on the Daily Chart
On the daily chart, DOT is navigating through crucial price levels with current support at $8.68. Should the price maintain above this support level, it could signal strength and potential for a recovery phase.
However, a break below could see DOT testing lower grounds. The resistance to watch is $9.73, which stands as the gatekeeper to further uptrends. Surpassing this level could pave the way for DOT to aim for higher price levels.
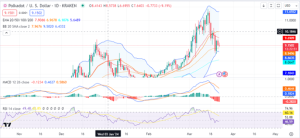

The oscillators and moving averages present a mixed sentiment. The Relative Strength Index (RSI) remains neutral, suggesting a balance between buying and selling pressures. The Stochastic RSI is neutral as well, indicating the potential for either direction in the price movement.
The MACD indicator on the daily chart shows a buy signal, which might entice bullish traders. However, the Awesome Oscillator and Momentum are in the selling territory, advising caution as the market could still lean towards bearishness.
DOT Consolidates Near Key EMA Levels on 4-Hour Chart
In the 4-hour chart for Polkadot (DOT), the price trend has shown a consolidation phase around the $9.15 mark, with the Exponential Moving Averages (EMAs) depicting a crossover pattern suggesting a potential change in trend.
The 20 EMA has dipped below the 50 EMA, often interpreted as a bearish signal, while the price hovers just above the 100 EMA at $10.04, indicating a critical juncture that could determine the next direction for DOT’s price.
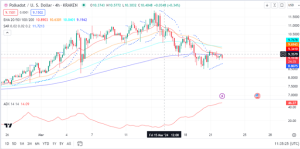

The Parabolic SAR, marked above the price, reinforces this bearish outlook, indicating a potential downtrend. Furthermore, the Average Directional Index (ADX) value stands at 14.09, signifying weak trend strength and a market that could be indecisive.
However, the relatively low ADX also means that any subsequent move could establish a new trend, with current resistance and support levels at $9.76 and $8.80, respectively, providing boundaries for potential price breakouts or breakdowns.
Open Interest (OI) and Market Outlook
The mild increase in Open Interest hints at a growing interest from buyers but might not be significant enough to break through the resistance. Polkadot has a 24-hour trading volume of $310,764,461, a significant indicator of market participation.
While DOT shows some recovery, the price is delicately poised with room to grow before encountering strong selling pressure. Despite the slight price increase, DOT remains lower than its mid-March high.
The recent uptick in price hasn’t fully turned the sentiment positive, as indicated by various technical indicators showing neutrality or slight bearishness. The positive funding rate signals that the perpetual price is trading at a premium, suggesting bullishness among traders. Nonetheless, the stalling price action warns of possible consolidation or downturns ahead.


