


Chainlink (LINK) token continued its winning streak for the third consecutive day, reaching a five-week high at $16.3 on May 16.
The token is up more than 28% in the past three days, rising from levels below $012.8.
The performance follows a successful completion of DTCC and prominent US banking institutions signal significant potential for Chainlink. The successful completion of these tests, involving companies like American Trust Custody, Edward Jones, and JPMorgan, aims to expedite the tokenization of assets. The collaboration includes major players such as Franklin Templeton and BNY Mellon, paving the way for notable advancements.
We’re excited to share the results of a new Smart NAV industry pilot between @The_DTCC, Chainlink, and 10 of the world’s largest financial institutions that delivered key mutual fund data onchain.
Full report: https://t.co/ob3K0s4g86
The significance for fund tokenization 🧵 pic.twitter.com/74zocXa2s0
— Chainlink (@chainlink) May 16, 2024
With these tests, Chainlink’s Cross-Chain Interoperability Protocol (CCIP) is now able to act as an abstraction layer among multiple blockchains, facilitating integration with DTCC now and in the future.
Co-founder Sergey Nazarov highlights the significance, noting that key market participants are solving real-world problems by integrating blockchains, smart contracts, and Oracle networks.
As the amount of bank chains rapidly increases, all of the smart contracts on those chains will need data to generate their real world assets and connectivity to transact across hundreds of different chains. Chainlink is the only platform that provides both in one solution.… pic.twitter.com/snKrdB2T4Z
— Sergey Nazarov (@SergeyNazarov) May 8, 2024
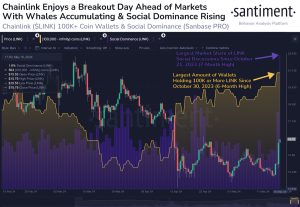
Data from market intelligence firm Santime reveals that the recent Chainlink price rally comes on the backdrop of strong LINK whale activity, setting it apart from the broader cryptocurrency market.
The firm shared the following chart in a May 17 post of the X social media platform showing that the number of LINK whales—addresses holding 100,000 LINK or more—has risen to 564, marking a 4.6% increase in just five weeks.
Santiment notes that if social dominance remains steady and FOMO, does not dominate, bullish conditions could be on the horizon for Chainlink.
The firm said,
“Chainlink enjoys a breakout a day a head of markets with whales accumulating and social dominance rising.”
Chainlink wallets with more than 100K LINK. Source: Santiment

Chainlink price analysis: Key levels to watch moving forward
The LINK price turned away from a 26-month high at $22.87 on March 11, dropping more than 47% to set a swing low at $15.46 on April 13.
The Chainlik price has traded with a bullish bias in three consecutive bullish sessions on the daily chart with the $17.0 supplier congestion zone posing immediate resistance. Bulls will now look to flip this level into support with the key levels to watch on the upside being the 50% Fibonacci retracement level at $17.42 and later $18.7, embraced by the 81.8% retracement level.
Breaching this level will clear the way toward the 78.6% retracement level and later move higher to complete the retracement at $22. This would represent a 40% uptick from the current level.
All the major moving averages were trailing the price and the position of the relative strength index at 64 close to the overbought region validated the dominance of the buyers in the market.
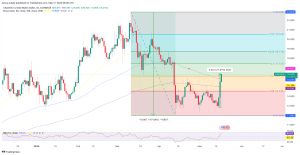

LINK/USD daily chart. Source: TradingView
On the other hand, the near-overbought RSI suggested that the LINK price could soon turn down from the current levels as buyer exhaustion and profit-booking kicks in.
The first key level to watch on the downside are the $16 to $15 demand zone, where the 50-day exponential moving average (EMA), the 100-day EMA and the 200-day EMA sit.
Other levels include the 23.6% Fibonacci retracement level at $14.54 and the psychological level at $4. Other lines of defense could emerge from the psychological level and the swing low at $12.
This could be where Chainlink’s downside could be capped in the near term.


