


Over the past day, Chainlink’s price has demonstrated a series of fluctuations, showcasing a blend of bullish and bearish sentiments. The 24-hour trend indicates that the price initiated at a level higher than its current position experienced a dip to a lower level, underwent a partial recovery, and subsequently declined toward the end of the period. This succession of movements delineates an overall downward trend, with the price concluding lower compared to its initial value within 24 hours.
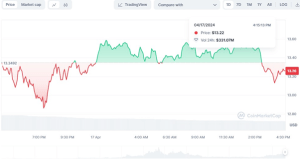

Chainlink (LINK) 24-hour price chart (source: CoinMarketCap)
During this period, LINK encountered notable price levels that delineate potential support and resistance zones. The highest price recorded stands just above $13.60, representing a temporary resistance level where selling pressure could impede further upward movement. Conversely, the lowest price observed, slightly surpassing $13.00, indicates a potential support level where buying interest may mitigate further downward movement.
Market Dynamics and Investor Behavior
Chainlink’s recent price actions coincide with heightened trading activity, as evidenced by a notable increase in trading volume, marking a surge of 38.81% within the 24-hour timeframe. Such a surge in volume suggests heightened trader interest and activity, potentially influencing the price dynamics of LINK.
At the same time, market sentiment is influenced by various factors, including investor behavior and prevailing market conditions. The occurrence of a large red candlestick towards the end of the chart indicates a sudden bearish market reaction, reflecting the impact of prevailing market sentiments on Chainlink’s price trajectory.
Chainlink’s Potential Breakout: Analysis and Forecasts
Despite the recent volatility, Chainlink’s price shows signs of a potential breakout from its current downtrend, hinting at a prospective recovery from recent losses. Investor behavior aligns with this possibility, as Chainlink may encounter support from investors aiming to prevent further decline below the $13.5 mark.
Each time #Chainlink MVRV 30-Day Ratio has dropped below -12.24% since August 2022, it’s signaled a prime buying opportunity, averaging 50% returns!
Currently, $LINK MVRV 30-Day Ratio stands at -17.54%. This could be another chance to buy the #LINK dip! pic.twitter.com/3iFJqDvP8C
— Ali (@ali_charts) April 17, 2024
The analysis is further substantiated by the Market Value to Realized Value (MVRV) Ratio, which indicates a favorable state for accumulation. Historically, Chainlink’s recovery tends to occur within specific MVRV ranges, suggesting an opportunity zone for accumulation. Consequently, investors may view the current price levels as conducive to accumulating LINK tokens, potentially driving upward price movement in the near term.
Price Predictions and Technical Analysis
Chainlink’s price currently hovers around the $13.4 support level, with indications of potential recovery from this point. Supported by market dynamics and investor sentiment, LINK could witness a rebound once it surpasses key resistance levels, particularly the $14.6 mark. Subsequent bullish momentum could propel Chainlink’s price toward the $17 barrier, contingent upon sustained market support and favorable trading conditions.
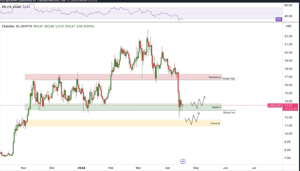

LINK/USD price chart (source: TradingView)
However, it’s crucial to consider alternative scenarios, such as the possibility of a further price decline, particularly if Chainlink fails to maintain support above critical levels. Failure to consolidate support at levels around $14 or $13.55 could invalidate the bullish thesis, potentially leading to a reversal in price movement.


