


Chainlink (LINK), the decentralized oracle network’s native cryptocurrency, has been capturing traders’ attention with its recent price movements. According to the latest statistics, LINK is currently trading at $18.22, down 14.32% over the past month, 8.52% in the last seven days, and 1.84% in the last 24 hours.
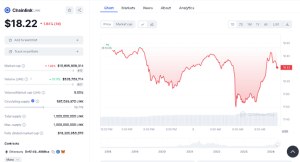

LINK Data Chart (CoinMarketCap)
With a market capitalization of $10.9 billion, LINK ranks as the 15th largest cryptocurrency by market cap. Its 24-hour trading volume stands at over $535 million and the volume-to-market-cap ratio for LINK over the past 24 hours is 4.79%. The circulating supply of LINK is 587,099,970, representing 58.71% of its total supply of 1,000,000,000, which is also the maximum supply for the cryptocurrency.
LINK has recently been the subject of intense trader interest after a strong rally pushed its value towards the coveted $20 mark. However, this level has proven to be a significant resistance point, as indicated by the recent price action. LINK has been unable to secure a stable position above the $20 threshold, retreating to its current price level of $18.22 as of writing. This retreat reflects a moment of rebalancing in the market, with potential short-term profit opportunities for bearish traders.
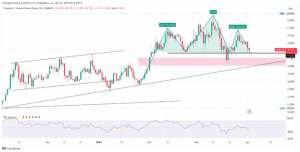
On the weekly timeframe, the cryptocurrency’s attempt to climb has been met with challenges. Current technical levels to watch include support at $17.6, which acts as the neckline for the head and shoulder pattern and $16.3, which is the recent low recorded when prices retraced to fill a daily fair value gap in the market.

LINKUSD Weekly Chart (TradingView)
LINK’s journey has been met with tough resistance at $20 level, which is the right shoulder of the head and shoulder pattern, an anticipated profit-taking region that was once a breachable target after ascending from the support level of $16.26.
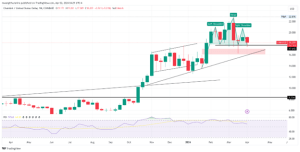
Turning to the daily timeframe, the price is currently at the support of the head and shoulder pattern which is the neckline. While the price has reacted favorably to the support level, buoyed by the strong neckline, the direction remains uncertain. Prices can either drop to test the double support of the recent low at $16.2 and the ascending trendline or rally upwards to retest the right shoulder or the head at $22.7 level.
LINKUSD Daily Chart (TradingView)
The Relative Strength Index (RSI) on the daily timeframe reads 43.61, nearing the oversold region, which could suggest the potential for bullish trends in the next few days. Prices are more likely to react to the double support level at $17.2 in the near term rather than the current neckline. However, before any further drop, prices are much more expected to respect the neckline and show some bullish momentum first.
The narrative surrounding Chainlink is gaining traction, with one analyst stating, “Now Chainlink I think is now massively undervalued and that’s gonna be because of the cross-chain that’s known as CCIP.” CCIP, or Cross-Chain Interoperability Protocol, is a crucial development for Chainlink, enabling the integration of its decentralized oracle network across multiple blockchains.
The $LINK narrative is starting to take notice
“Now Chainlink I think is now massively undervalued and that’s gonna be because of the cross-chain that’s known as CCIP”
The world is waking up https://t.co/VvyTUtyT3C
— Crypto Moose🫎 (@MooseCryptos) April 2, 2024
Projects like Chainswap and Xswap are emerging as key players in the CCIP ecosystem, with Chainswap’s $CSWAP token being hailed as a game-changer. As the Chainlink ecosystem continues to evolve and expand, the potential for increased utility and adoption could drive further interest in LINK.


