


The Cardano blockchain has recorded a massive amount of 25 billion ADA tokens transferred within 24 hours. This surge in large transactions points to significant movements by major players, be they whales or institutional investors. While Cardano’s fundamentals remain strong, its price has seen volatility in recent weeks.
Cardano (ADA) Sees 25 Billion Tokens Transferred in 24 Hours: What’s Going On? #Cardano #cardanofeed #trading #ADA #crypto #CardanoCommunity #bitcoin #blockchain @otaviolima #cryptocurrency #CardanoADA #btc $ADA https://t.co/SCH8cEIJxC
— Cardano Feed ($ADA) (@CardanoFeed) April 24, 2024
After a period of decline, ADA is currently trading around the $0.47 level today, April 25th, 2024, down 6.57% over the last 24 hours and 26.99% in the past 30 days as of writing. Also, Its market cap stands at $16.9 billion, making it the 10th largest cryptocurrency surpassed by Toncoin.
The 24-hour trading volume for ADA has been relatively high at over $502 million, equating to a 23.75% increase in the last 24 hours also. Analysts view these sizeable on-chain transactions as indicative of major market participants positioning themselves for potentially significant future price movements.
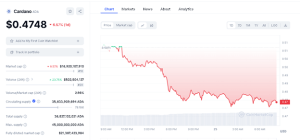

Cardano Data Chart (CoinMarketCap)
Whenever we see this level of activity from the cryptocurrency whales, it usually precedes volatile price swings. Big money is either taking profits or accumulating in anticipation of an imminent rally or sell-off. The spike in large ADA transactions peaked at a huge 27.67 billion tokens transferred recently.
Whether this latest burst of whale transactions will catalyze a Cardano price surge or precipitate a major sell-off remains to be seen. But our technical analysis provides some potential insight. Let’s take a look.
ADA Technical Analysis
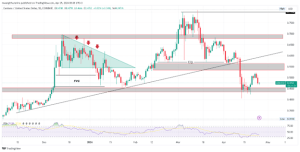
On the weekly chart, ADA is gaining bearish momentum after closing bullish last week. Since March 14th when Cardano faced its second rejection after topping out at $0.81level, it has been trading bearish, with most weekly candles closing in the red. Last week offered some hope with a bullish weekly close, but this week has reverted to bearish so far. Is this more of a retracement to the downside or a bearish continuation in an attempt to break the crucial support?

ADAUSD Weekly Chart (TradingView)
Daily Technical Analysis
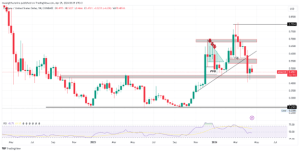
On the daily timeframe, ADA is trading above a key support zone around $0.445 where it previously faced rejection. The price is now heading towards an ascending trendline resistance at $0.60 which was broken on April 11th. With its RSI at 39 and nearing oversold levels, there could be more room for buying pressure to test these resistance levels. A bullish continuation could see a move to fill the fair value gap below $0.60 ascending trendline resistance. However, if bears regain control before we get there, a retest of the $0.445 support is still so possible.
ADAUSD Daily Chart (TradingView)
4-Hour Price Analysis
Over the shorter 4-hour charts, ADA’s price has been trading and consolidating in a range between $0.45 and $0.52 as traders await the next major directional move.
Overall, the explosive growth of the Cardano ecosystem and the inflow of new projects and applications all point to immense long-term upside potential for ADA. But in the short-term, the market’s response to such choppy movements will determine whether the token can regain its bullish momentum or if the current consolidation gives way to another selloff.


