


Despite a bullish start to the day, Cardano (ADA) price has faced stiff resistance at the intra-day high of $0.455. Consequently, the ADA market succumbed to bearish pressure, with prices dipping to a low of $0.4445 before establishing support. However, a bullish attempt for recovery was nullified after a retest of a lower high of $0.4498 during the day.
If the bulls manage to breach the $0.455 high, the next resistance levels to watch will be at $0.46 and $0.465. On the other hand, if the bears continue to dominate, ADA could retest support levels at $0.44 and $0.435. As of press time, however, ADA was trading at $0.4483, a 0.07% surge from the intra-day low.
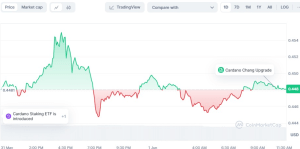

ADA/USD 24-hour price chart (source: CoinMarketCap)
Concurrently, ADA’s market capitalization soared by 0.05% to $16,001,437,053 while the 24 hour trading volume fell by 16.23% to $263,484,818. This increase in market capitalization indicate growing investor interest in ADA, despite the recent price fluctuations. However, the decrease in trading volume may suggest a temporary lull in market activity, potentially leading to increased volatility.
#Ripple CEO predicts at Consensus 2024 the imminent approval of an #XRP ETF:
‘I think it’s just a matter of time, and it’s inevitable there’s going to be an XRP ETF, there’s going to be a Solana (SOL) ETF, there’s going to be a Cardano (ADA) ETF, and that’s great!’ 🚀🚀🚀 pic.twitter.com/Y29d1AOvZw
— Collin Brown (@CollinBrownXRP) May 31, 2024
Bulls are however keeping an eye on the Cardano ETF speculations, which may bring about an exponential surge in the ADA price. This anticipation was bouyed by Ripple CEO Brad Garlinghouse at the Consensus event held in Texas. In his statements, despite noting the regulatory difficulties in such a move, Garlinghouse was positive that Solana, XRP, and Cardano were next after the recent approval of 19b-4 filings on spot Ethereum ETFs.
ADA/USD Technical Analysis
On the ADAUSD 4-hour price chart, the Keltner Channel motion downwards and converging suggest waning volatility and bullish momentum. The upper KC band and lower band touch at $0.462 and $0.44, respectively, acting as potential support and resistance levels in the short term.
The developing green candlesticks resulting from the rebound from the lower band suggest bullish momentum is building. A bullish stance may be confirmed if the price action shifts above the middle line at $0.451.
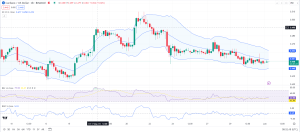

ADA/USD 4-hour price chart (source: TradingView)
The Relative Strength Index (RSI) rating of 43.96 supports the bullish momentum developing as the market moves out of the oversold region. A move of the RSI above the 50 region may confirm this bullish shift. However, if the RSI fails to move above this, bearish momentum may still have a chance to take control.
Adding to the optimism, the Rate of Change (ROC) has moved out of the negative region, suggesting a positive trend. With a ROC rating of 0.45 and moving upwards, the bullish trend is increasing, pointing to a potential re-testing of the intra-day high.


