


After a bull-bear power struggle in the last 24 hours that has swayed the Cardano (ADA) price between an intra-day low and high of $0.5984 and $0.6158, respectively, the bulls emerged victorious. At press time, ADA was still under bullish momentum, trading at $0.6104, a 0.40% surge from the support zone. The 0.41% surge in market capitalization to $21,737,097,323 and a 24-hour trading volume surge by 4.72% to $427,962,891 reflects the increased investor confidence.


Cardano’s Market Sentiment and Technical Indicators
The recent upturn in Cardano’s market sentiment is underscored by its performance on the technical charts. The ADA token has shown resilience, holding above the crucial $0.60 support level. Analysts observe a bullish pattern, with the price action suggesting a potential continuation of the upward trend.
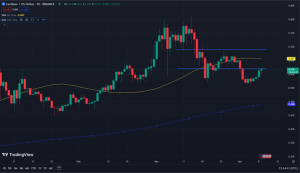

ADA/USD 24-hour price chart (source: TradingView)
The presence of the 200-day simple moving average below the current market price of ADA is a bullish indicator, while the 50-day SMA still poses a hurdle above the current price level. A break above this level could catalyze further upward momentum. Moreover, the fading red MACD histogram bars indicate a reduction in bearish pressure, further bolstering the optimistic outlook for ADA.
Network Developments and Analyst Predictions
Cardano’s network activity has also contributed to the positive market sentiment. The network recently reported a milestone of over 88 million transactions, signaling robust use and engagement. This achievement has helped dispel notions of Cardano being a “ghost chain,” highlighting its vibrant ecosystem.
In light of these developments, analysts have set ambitious targets for ADA, with predictions suggesting a potential rise to $7. This bullish outlook is further supported by the anticipation of Cardano’s Fund12 launch, which aims to foster innovation and attract new developers to the platform.
Concurrently, the ADA price has demonstrated significant resilience, rebounding from recent lows and initiating a new bullish trend. With the price now trading above key support levels and technical indicators signaling strength, the focus shifts to upcoming resistance levels.
A break above the $0.620 resistance could pave the way for further gains, with targets set at $0.69 and potentially $0.81 in the near term. However, the path forward is contingent on maintaining the current momentum and breaking through key technical barriers.
ADA/USD Technical Analysis
On the ADAUSD 4-hour price chart, the Bull Bear Power (BBP) motion in the positive region developing higher bars suggests that buyers are in control and that the bullish momentum is likely to continue. If the BBP continues to show strength and remains in the positive region, it could indicate a strong likelihood of ADA/USD breaking through resistance levels and reaching the set targets.
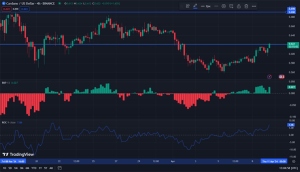

ADA/USD 4-hour price chart (source: TradingView)
Concurrently, the Rate of Change (ROC) rating of 7.40 and moving upwards suggests that the current uptrend is gaining strength and may lead to further price increases. If the ROC continues to rise, it could confirm the bullish momentum and signal a potential continuation of the uptrend in ADA/USD. However, traders should also monitor for any signs of overbought conditions or potential reversal patterns to manage risk effectively.


