


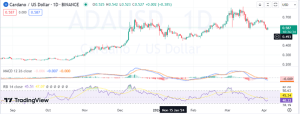
Cardano’s ADA token is currently experiencing modest trading activity in the cryptocurrency market, demonstrating a delicate balance in price. As the market undergoes a period of correction, ADA maintains its stand, trading at a precise $0.5876. This trading level is particularly significant as it hovers above the vital support line of $0.5221, an area that historically has been defended robustly by buyers.
The resistance mark lies at around $0.6045, a breach of which could potentially lead to a test of the $0.6 threshold. This price point for ADA has been a consistent barrier in previous sessions, setting the stage for either a breakthrough or a pullback. The chart indicates that ADA has made attempts to surpass this resistance but has met with considerable selling pressure.

The broader cryptocurrency market is not in the best of health, with Bitcoin taking a significant step back, falling below $66,000. This downturn has rippled across the market, with altcoins, including Cardano, feeling the pinch. Despite the prevailing bearish winds, ADA’s current price action shows signs of resilience. Cardano has not been immune to the sell-offs but has managed to keep above critical support levels.
The technical analysis of ADA’s current price reflects a tug-of-war between opposing market forces. The trading pattern shows a struggle to maintain upward momentum, with each rally met with resistance. The Moving Average indicators reveal that ADA is treading below a key level which could act as dynamic resistance going forward. A close watch on these averages may provide insight into the potential direction ADA may take.
The Relative Strength Index (RSI) and Moving Average Convergence Divergence (MACD) also provide critical insights into the asset’s momentum. The RSI hovers near mid-levels, indicating neither overbought nor oversold conditions. Meanwhile, the MACD signals caution, suggesting that the current trend could sustain before any significant reversal is seen.
ADA Eyes a Reversal from Recent Lows
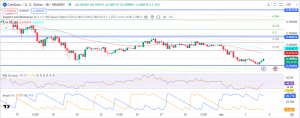

In the recent 4-hour trading sessions, ADA has been trading at a crucial juncture with its price currently sitting above $0.580, showing a modest rise of 0.80%. This slight uptick comes after ADA has experienced a period of consolidation, hovering around key support levels. The 50-period EMA lies just above the current price at $0.613509, acting as immediate resistance that ADA needs to overcome to signal a potential bullish reversal.
Technical indicators suggest a mixed outlook; the RSI, at 43.07, indicates that ADA is neither in the overbought nor oversold territory, offering room for movement in either direction. Meanwhile, the Aroon indicator shows a dominance of downward momentum, but with the uptrend line beginning to climb, hinting at possible changing tides.
As ADA continues to navigate these levels, the next significant resistance is plotted at $0.634304, a breakout above which could pave the way to test higher Fibonacci retracement levels. On the downside, should ADA fail to hold its ground, it could retest the recent low of $0.580710, where a firm bounce needs to occur to prevent further declines. The market’s next moves hinge on ADA’s ability to break above the EMA and reverse the trend indicated by the Aroon indicator.


