


Bitcoin, the world’s largest crypto by market capitalization, is capturing the attention of investors as it navigates a period of heightened volatility amidst growing institutional adoption. Despite its recent bearish price action, the long-term outlook for Bitcoin remains bullish, fueled by a confluence of positive developments across the globe.
At the time of writing, Bitcoin is trading at $62,352.69, down 2.12% over the past 24 hours and 5.60% over the last 7 days. Its market cap stands at over $1.2 Trillion, cementing its position as the dominant force in the crypto market.
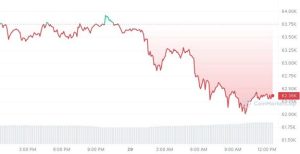

BTC Price Chart: CoinMarketCap
Bullish Predictions and Institutional Adoption
Despite the recent volatility and bearish momentum, analysts remain optimistic about Bitcoin’s future. Standard Chartered bank analyst’s ambitious price target of $150,000 for Bitcoin by the end of this year stresses the crypto potential. The analyst reiterated this bullish stance, citing
NEW: Standard Chartered bank analyst says #Bitcoin is still on track to reach $150,000 by the end of the year 🚀 pic.twitter.com/SPrJiU6z07
— Bitcoin Magazine (@BitcoinMagazine) April 22, 2024
Adding to the bullish sentiment, Hong Kong is set to witness a significant milestone in crypto adoption. Starting tomorrow, April 30th, Bitcoin and Ethereum spot ETFs will officially begin trading in Hong Kong, paving the way for increased institutional inflows into the digital asset space. Also, Australia is poised to approve spot Bitcoin ETFs this year, according to Bloomberg reports. The entry of these regulated investment vehicles is expected to attract a wave of institutional capital, further solidifying
𝗝𝗨𝗦𝗧 𝗜𝗡: Bitcoin ETFs are coming to Australia. 🇦🇺
Australian Securities Exchange (ASX) is expected to approve the first spot Bitcoin ETFs before the end of 2024.
The world is on a Bitcoin adoption spree, yet people are hesitant to buy $BTC at current prices.
— Lark Davis (@TheCryptoLark) April 29, 2024
Moreover, the Asian market for cryptocurrencies is larger than the combined markets of the United States and Europe, presenting a vast untapped potential for Bitcoin adoption. As awareness and regulatory clarity increase, the region could emerge as a driving
BREAKING: HK #Bitcoin ETF launches tomorrow.
And here’s a little secret from this part of the world…
The Asian market in user count is BIGGER than the US and European markets combined.
(2022 Huobi report) pic.twitter.com/wwH3WAnDty
— Willy Woo (@woonomic) April 29, 2024
BTC Technical Analysis
The technical analysis of Bitcoin’s price movements paints a compelling picture for traders and investors alike. Over the past four weeks, Bitcoin has been bearish, dropping 10.94% in the last 30 days. Notably, BTC has closed bearish for four consecutive weeks, with the current weekly candle also displaying a bearish trend.
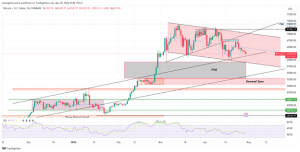

Bitcoin appears to be trapped in a parallel descending channel, which is a bullish flag pattern. After the highly anticipated halving event on April 19th, 2024, Bitcoin displayed bullish momentum, finding double support at the ascending trendline and the bottom of the bullish flag pattern around the $59,900 zone.
Currently, Bitcoin is trading towards re-testing the ascending trendline or the support of the bullish flag pattern. With the Relative Strength Index (RSI) reading at 41, close to the oversold region, the price might bounce back at the trendline support. However, if it breaks to the downside, support lies at $59,573.
As BTC navigates through market volatility, its underlying fundamentals continue to strengthen. The impending launch of Bitcoin and Ethereum spot ETFs in Hong Kong, coupled with the anticipated approval of spot Bitcoin ETFs in Australia, signals a growing acceptance of crypto by institutional investors. With bullish price predictions from analysts and the vast potential of the Asian market, Bitcoin’s future looks brighter than ever, positioning it as a formidable asset class in this evolving financial landscape.


