


Bitcoin, the world’s largest cryptocurrency by market capitalization, has experienced a remarkable surge in value over the past week, with its price climbing to $70,447.60, reflecting a 6.13% increase over the past seven days at some point today but a 0.85% drop in the last 24 hours. Bitcoin’s market capitalization stands at over $1.35 trillion, cementing its position as the leading digital asset.
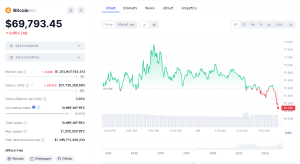

BTC Data Chart(CoinMarketCap)
The trading volume for Bitcoin over the past 24 hours read at $31.7 billion, accounting for a 24.22% decrease compared to the previous day. However, this dip in trading activity did not deter the cryptocurrency’s upward trajectory, as its volume-to-market cap ratio remained at a healthy 2.32%. Bitcoin’s circulating supply currently stands at 19,667,287 BTC, with only a limited number of coins left to be mined before reaching the maximum supply of 21 million.
Technical Analysis: Bullish Signals and Crucial Levels
From a technical perspective, Bitcoin’s recent performance has been nothing short of impressive. The weekly candlestick analysis reveals that the cryptocurrency has surged this week, bouncing back after encountering bearish momentum over the past two weeks. The previous two weekly candles closed bearish after Bitcoin reached an all-time high of $73,835.
Notably, last week’s candlestick closed as a Hammer candlestick, signaling bullish momentum and pressure, which has been witnessed this week with the current weekly candle still bullish. As the current weekly candle is more likely to close bullish, short-term traders may face a challenging period ahead.
Resistance levels have been identified at recent all-time highs, while support is noted at the $66,381 zone, which is the weekly low so far.
Daily Technical Outlook: Bearish Trend Prevails
Although the weekly outlook appears bullish, the daily analysis paints a different picture, with Bitcoin’s bearish trend kicking in and prices experiencing downward pressure today. This bearish sentiment may lead to a potential retest of the resistance-turned-support level at the $68,750 zone.
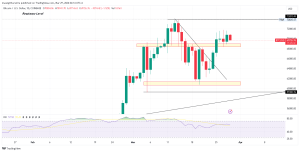

BTCUSD Daily Price Chart (TradingView)
The daily candlestick opened at $70,804.06, with highs reaching $70,941.70 as of writing. If bearish sentiment continues to dominate and bulls fail to take control, prices may test support levels at the $68,750 zone. The Relative Strength Index (RSI) indicator currently stands at 58, reflecting a neutral sentiment among traders.
4-Hour Analysis and Halving Event Anticipation
In the 4-hour timeframe, Bitcoin has recently encountered resistance at the recent high of the $71,789 zone, with potential retests of the immediate support at the $68,750 zone. However, if bulls manage to push further after testing the support, a rally toward the ATH $73,835 zone and beyond is imminent. The RSI stands at around 54, indicating a balanced market sentiment.
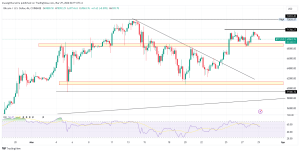
BTCUSD 4-Hour Price Chart (TradingView)
Notably, if bears gain more momentum at the support level and break it, we might witness a move towards a retest of the descending trendline, keeping in mind the anticipated Bitcoin halving event.
The next Bitcoin halving, a crucial event that reduces the rate at which new Bitcoin is created, is expected to occur in approximately mid-April 2024. The cryptocurrency community highly anticipates this event, as it is one of the most important features of Bitcoin, ensuring its limited supply and issuance mechanism.
1/18 What happens to altcoins after the Bitcoin halving takes place?
A thread 🧵👇 pic.twitter.com/NQmN0kLiG3
— Crypto Nova (@CryptoGirlNova) March 27, 2024
As we approach this significant milestone, the market dynamics and technical indicators will undoubtedly be closely watched by traders and investors alike, as the halving event has historically had a profound impact on Bitcoin’s price trajectory.


