


Bitcoin (BTC), the largest cryptocurrency by market value, is currently experiencing significant price fluctuations. As of today, BTC’s price hovers above $60k, with a trading volume of $28.43 billion in the last 24 hours. Amid this turbulent period, market watchers are closely monitoring key technical levels that could dictate the short to mid-term price trajectory of this leading digital asset.
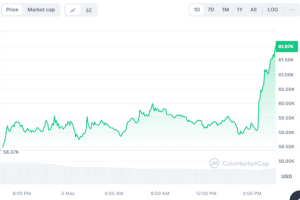

Bitcoin has shown resilience despite a broader downturn, with its price oscillating between $57,789 and $60,000 today. Following a peak at $72,750 on April 7, BTC experienced a sharp decline, finding a temporary foothold at around $56,500 by April 30. This support level represents a critical juncture, as further breaks could exacerbate the bearish momentum.
The sell-off has somewhat stabilized, particularly after the recent Federal Reserve meeting and ahead of the U.S. nonfarm payrolls data, which is keenly anticipated by investors to gauge potential economic cues that might impact the cryptocurrency market. This data could influence expectations around Federal interest rate adjustments, directly affecting investment flows into risk assets like Bitcoin.
Bitcoin (BTC) Faces Resistance at $63k Amidst Market Consolidation
Bitcoin (BTC), the flagship cryptocurrency, currently trades at around $61,196, as shown in the latest market data. The price action of Bitcoin is under scrutiny as it tests critical resistance and support levels amidst ongoing market consolidation.BTC faces immediate resistance near the $63,283 mark.
This level aligns with recent highs and a pullback from this point could indicate that the market is not ready to sustain a higher valuation in the short term. The next significant resistance stands at $65,891, which represents a recent peak in price.
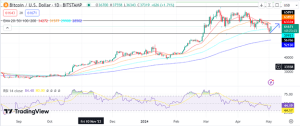

On the downside, the crucial support to watch is $59,313, which aligns with the 50-day Exponential Moving Average (EMA). This moving average often acts as a dynamic support in uptrending markets. A break below this level could see BTC testing further support near $56,766, coinciding with the 100-day EMA.
The chart showcases the 20-day, 50-day, 100-day, and 200-day EMAs, with the price currently testing the 50-day EMA as support. The positioning of the EMAs indicates a generally bullish trend over the medium term, but the recent price action suggests a possible consolidation or correction phase.
The RSI is currently at 59.52, which is just below the overbought territory. This indicates a high level of buying activity recently, though it is starting to wane slightly, suggesting that buyers may be becoming cautious at current levels.


