


The crypto market has been trading bearish lately, with major coins experiencing significant price drops and swings. Among them is BNB, the native cryptocurrency of the leading crypto exchange Binance. Despite the volatility, BNB remains a prominent player in the digital asset space, with its strong platform and innovative offerings positioning it for continued growth.
As of today, BNB holds the fourth position in the crypto market by market cap, boasting a $84.1 billion valuation and trading at $569.25, a 3% drop in the last 24 hours. In the last 24 hours, BNB has also seen a trading volume of over $1.9 billion, a 28% increase in the last 24 hours, a renewed interest and confidence in investors in its potential.
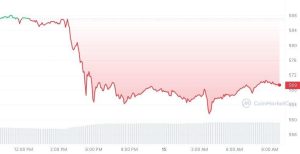

BNB Price Chart: CoinMarketCap
Price Movements and Liquidations
BNB’s price has experienced substantial fluctuations recently, leading to a surge in liquidations across the network. Over the past few days, positions worth over $20 million have been liquidated, with more than $1.15 million liquidated on May 14th alone. Despite these losses, traders remain optimistic about BNB’s long-term prospects, as evidenced by the growing number of long positions taken in favor of the coin.
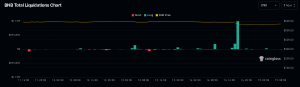

BNB Total Liquidations: Coinglass
Binance, the exchange behind BNB, has consistently proven its commitment to innovation and market expansion. The company’s Q3 targets suggest a continued growth trajectory fueled by strong platform updates, an expanding global presence, and innovative product offerings like the Binance Smart Chain. These factors are expected to drive increased adoption and potentially boost BNB’s market valuation.
Despite the recent price volatility, the BNB community remains resilient, with many traders maintaining a bullish outlook on the coin’s long-term prospects. As Binance continues to push boundaries and introduce new features, the anticipation for BNB’s future performance remains high among investors and enthusiasts alike.
BNB Technical Analysis
BNB’s technical indicators suggest a potential continuation of the bullish trend. Since recording a low of $287.6 on January 25th, the price rallied to a high of $645 on March 16th, representing a massive 124% gain in less than two months. Subsequently, the price corrected by 22% and has been trapped in a bullish pennant pattern.
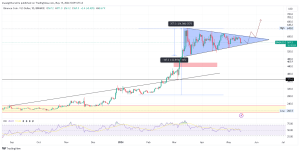

BNBUSD Price Chart: TradingView
Currently, BNB is trading with a slightly bullish bias in the daily candlestick. The daily Relative Strength Index (RSI) reading of 45 indicates that bearish momentum has been present in recent days. A breakout and close above the bullish pennant around $600 would confirm a bullish continuation of the trend, with bulls targeting the previous high of $645. Conversely, a breakdown and close below the bullish pennant support at around $555 would signal further corrections and movements to the downside.
BNB’s position as a prominent player remains strong. With Binance’s commitment to innovation and the resilience of the BNB community, the coin’s future looks promising.


