


Bitcoin is currently nursing significant losses, with its price dropping to $58,440.13, down 3.02% in the last 24 hours. The broader crypto market failed to sustain its recent positive momentum, leading to a decline during Monday’s early European trading session.
Market Sentiment and Upcoming US Economic Events
Market participants are closely monitoring upcoming U.S. economic events, including the release of the Federal Reserve meeting minutes. Bitcoin, which has struggled to hold above the crucial $60,000 level, bringing its price below $59,000. This decline led to $77 million worth of derivatives positions being liquidated, with long trades accounting for $50 million.
The current market sentiment, as indicated by the Fear and Greed Index, remains in a state of fear, worsened by declining social volume and growing negative sentiment. This dynamic has intensified selling pressure, causing further price declines.

Despite the recent downturn, some forecasts suggest a potential price rebound by September. Mining companies like Marathon Digital have made strategic investments, acquiring more Bitcoin, which could help restore market confidence and stabilize prices. Historically, Bitcoin’s price tends to surge approximately 160 days after a block reward halving, a milestone reached 125 days ago. This historical trend indicates a possible price increase by the end of September.
However, the ongoing “Extreme Fear” phase amid declining social volume could indicate lower investor participation rates. These factors may lead to further drops in Bitcoin price but still one cannot dismiss September rally possibilities especially given renewed investors’ trust in Bitcoin ETFs with significant inflows.
BTC Holds Above Pivotal $58,250 Level; Market Awaits Key Resistance Test
Bitcoin’s market shows signs of consolidation over the past few sessions evident both from a four-hour chart and daily chart analysis. Between $58,400-$59,200 range-based trading often held as both support as well as resistance has been seen on the four-hourly chart. This horizontal trading indicates lack of strong directional momentum as market participants could be waiting for more explicit macroeconomic signals or industry news before making significant moves.
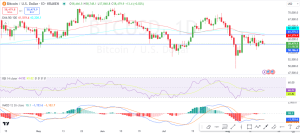
Bitcoin is oscillating around key exponential moving averages (EMA) on the daily chart. The 50-day EMA and 100-day EMA, which are converging around $59,000. Such a convergence would generally indicate that a price breakout is imminent. But both the 4-hour and Daily RSIs are close to 50 showing market indecision because neither overbought nor oversold conditions have been reached. At present, MACD on the daily chart is below the signal line but near zero indicative of a non-volatile market.
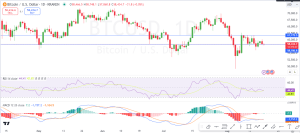

Traders may want to tread cautiously given current market conditions: looking out for breakouts above $59,200 resistance or breakdowns below $58,250 support could be potential signals for more pronounced moves.
If Bitcoin can hold above $58,250 support level then there might be positive bias with prospects of retesting resistance at $60,262. The breakthrough of this resistance level can cause further gains towards other levels such as $61,869 and $63,487 respectively. Conversely failure to maintain this support ($58,250) would result in selling pressure leading to sharp declines targeting down towards levels such as $56,151; $$54,633; or even possibly $$52,615.


