


Bitcoin, the leading cryptocurrency, has seen its price action fluctuate amidst varying market sentiments and whale activities. Today, Bitcoin is trading at $61,372.73, marking a decrease of 1.53% over the last day. This price movement is part of a broader trend observed in the cryptocurrency markets, where major coins have shown mixed reactions to global economic cues and investor behaviors.
Bitcoin Market Overview and Whale Activity
Today’s trading volume for Bitcoin stands at $24,180,184,093, a 4.41% decrease, indicating a cooling-off period after recent volatility. Despite this slowdown, the market capitalization remains hefty at $1,208,681,859,301. Notably, Bitcoin’s whale transactions have shown a dynamic shift; IntoTheBlock reports a decrease in large-scale wallet activity, hinting at a cautious approach from major investors.
Whales are buying the dip, but is their conviction dwindling?
🛍️Addresses holding over 1000 BTC have accumulated strongly in recent months, especially during dips.
📈Prices have increased shortly following every accumulation.
However, note that each spike in accumulation by… pic.twitter.com/OkbekJr5NC
— IntoTheBlock (@intotheblock) May 6, 2024
Typically, these whales have been pivotal in market recoveries, buying dips aggressively. However, the current reduction in their activity might reflect a strategic pause, evaluating the market post-halving and recent ETF developments.
Bitcoin’s price exhibits critical technical levels as it hovers just above the significant support at $60,660. The daily chart reveals a struggle to maintain momentum above this threshold, with potential to either springboard to higher valuations or succumb to bearish pressures.
Institutional Involvement and Market Sentiments
The recent engagement of financial giants like BNP Paribas, albeit with a modest investment, signals growing institutional interest. This engagement is pivotal, often serving as a confidence booster for retail and other institutional investors. Meanwhile, sentiment in the market, gauged through various analytics platforms, shows a blend of caution and optimism, a typical post-halving reaction where the market seeks direction amidst changing supply dynamics.
For Bitcoin’s immediate future, maintaining support above $60,660 is crucial. A breakdown below this level could trigger a sell-off towards $60,000 or even lower, testing mid-April supports. Conversely, a rebound from current levels, especially a conclusive breach above $63,871, could ignite a rally targeting the $76,166 mark, aligning with the upper boundary of the current falling wedge pattern observed in the market structure.
BTC Follows a Downtrend: Testing Key Support of $60k
In the latest 4-hour chart for Bitcoin (BTC), the price action reveals a cautious market sentiment as BTC trades below key Exponential Moving Averages (EMAs). Specifically, Bitcoin is oscillating below the 20-EMA ($62,237), 50-EMA ($62,011), and 100-EMA ($62,923), which are now acting as immediate resistance levels.
This positioning suggests a bearish outlook in the short term as these EMAs form a resistance cluster that could limit upward movements. The price is currently near $61,281, showing a slight recovery attempt within the trading band but remains under the influence of these upper resistance levels.
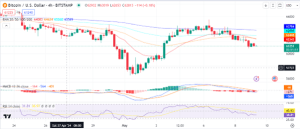

The Relative Strength Index (RSI) sits just above the neutral 50 mark, indicating a balance between buying and selling pressures. However, the flat trajectory of the RSI suggests a lack of strong momentum in either direction, reinforcing the ongoing consolidation phase.
Meanwhile, the Moving Average Convergence Divergence (MACD) is hovering near the signal line, with the histogram displaying minimal bars, which points to a market in indecision. The closeness of the MACD to the baseline also emphasizes the market’s uncertainty, as it lacks clear bullish or bearish signals. This technical setup requires BTC to clear these EMA hurdles to signal a potential bullish reversal or risk further declines if it fails to sustain above the critical support at $60,000.


