


Bitcoin (BTC) is trading above $67,000: The digital currency was trading lower after testing the $70,000 handle. The current trading price has been established to be $68,021. 84 .This has been seen to have risen by a 0.63% over the past 24 hours.
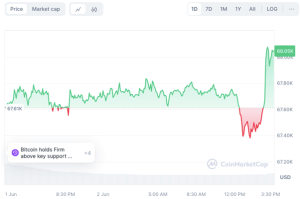

The market capitalisation has grown to nearly $1. 34 trillion, and the turnover of all transactions for the last 24 hours has reduced 46. 82%, amounting to $12. 53 billion. The consolidation phase that we see here implies a bullish breakout in the near future as the market waits for Bitcoin to move to the next level.
Market Analyst Insights
According to Rekt Capital, there is potential for Bitcoin to break through certain levels but needs to do so. The further movement of Bitcoin will be defined by the breakdown of the lower highs. ’ The expert also stressed that Bitcoin has been always rejected at the lower price zone, namely at $71600 and around $70000, which now are the levels of resistance
First, Bitcoin rejected at $71,500. Secondly, price confirmed the blue square as a local topping area. When this series of Lower Highs will be over, that is when Bitcoin will begin to rise again,” the Rekt Capital account explained.
Mags, a famous crypto analyst, pointed out that after BTC price moved above the last monthly resistance in March it cemented that level. It has been oscillating sideways above the previous all-time high for the past few months, implying that a large movement may be forthcoming. Bitcoin has always been observed to form a range before a major upswing and the slow price movement that is currently being witnessed may very well be a build-up to a major upswing.
BTC price analysis:Bitcoin holds key level at $68k
On the daily timeframe, there is a possibility that the consolidation phase might be nearing its end, as the dynamics of the market indicate a breakout. The nearest demand zone is $67,000 which has acted as a support level in the near term.
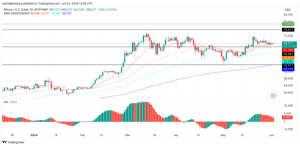

On the upside, resistance is noticed at $70,000 and $71,600, which are critical points that have checked BTC’s upward momentum in the past. In the event that the prices rise above these levels, this may be interpreted as a breakout pattern, which may indicate a bullish run.
EMA20 is higher than EMA50, which is a bullish signal. Thus, the 20-EMA is now being used as the dynamic support, which helps to soften the impact on the price. This alignment means that the short-term outlook is more favorable for buyers.
The current RSI is 51. 19, which is close to the half point on the scale. This means that the Bitcoin price is not on the extreme end of the overbought or oversold zone, which implies that the traders are not overly optimistic or pessimistic about the digital currency.
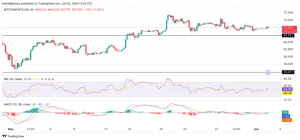

The price of Bitcoin has been moving in a downward trend, a phenomenon which is characterized by the formation of lower highs. However, if the price of BTC is to rise above the recent established highs, then this pattern will be nullified, and the market may be set for a bullish run. The levels to note are $70,000 and $71,600 because that’s where the prior climbs failed.


