


Bitcoin experienced a significant price surge today, with the cryptocurrency nearing $64,204.37, marking a 4.26% increase within a single day. This uptick follows the release of the US Consumer Price Index (CPI) for April 2024, which reported a 3.4% increase, aligning with market expectations. The anticipation surrounding the Federal Reserve’s potential easing of anti-inflation measures has positively influenced investor sentiment, prompting increased investment in Bitcoin.
The market cap of Bitcoin rose by 4.26% to approximately $1.26T, with the trading volume also showing a robust increase of 13.32% to reach $31.16 billion over the last 24 hours. This reflects heightened trading activity and investor interest following the CPI data release. The increase in volume suggests a strong buy-in from investors, likely anticipating that the Fed’s upcoming decisions might favor the cryptocurrency market.
BTC Clings to Gains as Technical Indicators Point to Possible Breakthrough
Technical analysis indicates that Bitcoin is testing crucial resistance levels. The day’s trading saw Bitcoin’s price starting near $61,500 and experiencing a sharp increase to the current level of $64,204.37. This movement places Bitcoin close to breaking through important psychological and technical resistance, potentially setting the stage for further gains if it can sustain above these levels.

The Relative Strength Index (RSI) for Bitcoin is approaching a bullish threshold, which could signal continued upward momentum if it remains above the midpoint mark of 50. This is complemented by increased market liquidity as indicated by the trading volume, suggesting that the price could stabilize at higher levels or possibly climb further if investor interest persists.
The recent buying trend and positive investor sentiment around Bitcoin are largely driven by expectations of a more relaxed monetary policy by the Federal Reserve. With the next Federal Open Market Committee (FOMC) meeting scheduled for June 12, the market is closely watching for any signs of rate cuts which could further decrease the cost of borrowing and potentially enhance the attractiveness of riskier assets like Bitcoin.
Bitcoin Price Analysis: Testing Key Support Levels on the 4-Hour Chart
In recent trading sessions, Bitcoin has shown resilience by testing crucial support and resistance levels, depicted in today’s 4-hour chart. Starting the day near $61,500, Bitcoin experienced a substantial rise, reaching a peak at around $64,205. This movement has brought Bitcoin close to challenging significant psychological and technical resistance at $65,000. The price action suggests a potential breakthrough, which could set the stage for further gains if it sustains above these levels.

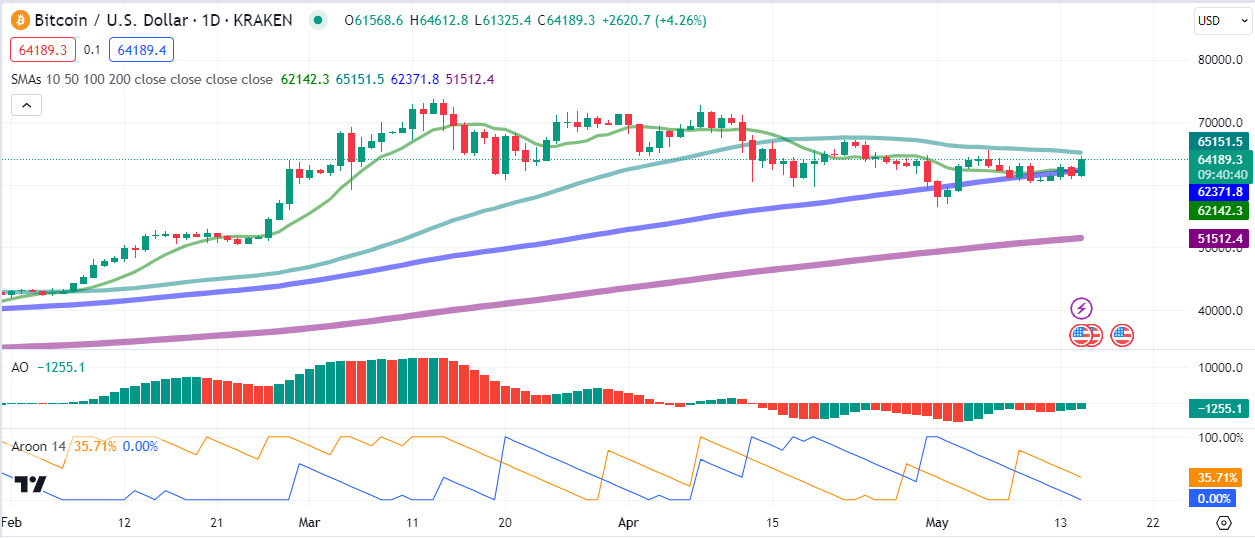
In addition to the price movement, technical indicators such as the Relative Strength Index (RSI) and the Awesome Oscillator (AO) reveal key insights into market sentiment. The RSI is approaching a bullish threshold near the 50 mark, which could signal continued upward momentum if it crosses above this midpoint.
Concurrently, the AO presents a slight recovery in momentum, although it remains in negative territory, indicating the need for caution among traders. Increased market liquidity, as indicated by the trading volume, suggests that the price could stabilize at higher levels or possibly climb further if investor interest persists.


