


Bitcoin (BTC) has shown volatility around the $60,000 zone in recent times owing to several economic indicators and market activities. Bitcoin is trading at $58,727.16 with a 24-hour trading volume of $26,933,701,890. Nonetheless, Bitcoin failed to break above its weekly resistance level of $58,500 even during today’s hike. Moreover, cryptocurrency prices are being impacted by sizeable transactions such as selling pressure from the transfer of 10 853 BTC by the German Government.
CPI Data Fuels Bitcoin’s Rally
The release of CPI data announcing an unexpected deceleration in inflation saw Bitcoin surge immediately. In June however, CPI was negative for the month falling 0.1% contrary to the 0.1% rise projected earlier on. In general terms, this news was welcomed positively as reduced inflation usually leads to a more relaxed monetary policy potentially bringing down borrowing costs and stimulating investment into riskier portfolio components such as bitcoin.

The favorable CPI data led to a spike in the price of bitcoin pushing it closer to its psychological threshold of the $60,000 mark; the suddenness with which that was done indicates how much investors are influenced by signs reflecting positive future monetary conditions for U.S central banks’ policies on cryptocurrencies.
Meanwhile in the filing that came alongside this publication more than half a billion dollars flowed into these securities yesterday alone – an indication that institutional buyers who may see current values favorably priced within their anticipation gains ahead would now be looking for entry points through this product line.
Bitcoin Oscillates Near $58,500: Technical Indicators Signal a Tentative Market
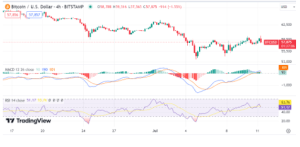
In recent trading sessions on a 4-hour chart, Bitcoin has witnessed sideways movements around one crucial hurdle at a $58,500 resistance level. This shows uncertainty among traders and investors as they try to determine possible shifts in market dynamics going forward. The Moving Average Convergence Divergence (MACD) in this timeframe presents a slightly bullish signal with the MACD line (blue) positioned above the signal line, suggesting an upward momentum. However, lines are too close to each other and histogram bars are modestly indicating that although there is a bullish sentiment, it is weak to facilitate robust breakout.
Relative Strength Index (RSI) sits at 56.79 which represents a moderately bullish level of RSI slightly below overbought territory of 70. This means that while there is some optimism in the market, it is not overwhelmingly bullish giving room for downward potential or further consolidation. A higher break could pave the way towards the $60,000 mark but any failure to maintain such levels could lead to a retest of lower support areas by Bitcoin.


