


The crypto market continued to whipsaw on June 10 with the global crypto market capitalization dropping only 0.37% on the day to $2.53 trillion. The total trading volume increasing approximately 1.83% over the last 24 hours to $54.16 billion.
The largest cryptocurrency by market capitalization Bitcoin (BTC) was barely unchanged at $69,365 while the proof-of-stake (PoS) token Ethereum (ETH) was down 0.5% to exchange hands at $3,671.
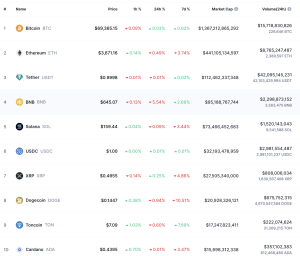

Performance of top 10 cryptocurrencies. Source: CoinMarketCap
All the other top-cap non-stablecoin cryptocurrencies had made very little losses or gains as shown in the chart above, reinforcing the ongoing sluggishness in the market.
The most notable move was displayed by BNB Chain’s BNB which was down 5.54% on the day to trade at $645.
Traders awaited for Bitcoin to chart a path that would be followed by all other cryptocurrencies.
The big crypto has had its daily trading volume increase by 30% over the last 24 hours to $15.9 billion.
This means the price may continue dropping if the bearish market sentiment persists.
However, data from Alternative, a platform that tracks emotions and sentiments around cryptocurrencies showed that the Crypto Fear and Greed Index was still in the “greed” zone at 72, up from 53 last month when it was in the “Neutral” zone.
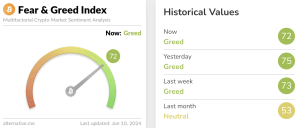

Crypto Fear and Greed Index. Source: Alternative.me
This means that market participants are still optimistic about the ongoing cycle as they expect BTC price to move even higher in the near future. This is shown by the continued inflows into spot Bitcoin ETFs.
Data from Farside Investors show that a total of $1.83 billion flowed into spot Bitcoin ETFs last week.
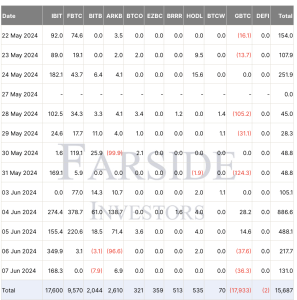

Bitcoin ETF flow table. Source: Farside Investors
This shows that institutional investors are continuously increasing their exposure to Bitcoin. If the demand continues, it will positively impact the price and send BTC into price discovery.
Bitcoin Price Analysis
BTC’s price action since May 1 has been defined by a series of higher highs and higher lows, leading to the appearance of an ascending parallel channel on the daily chart as shown below.
There was an attempt to push the price out of the channel on May 20 but it turned out to be a fake out as supplier congestion around the $72,000 psychological level rejected the price, taking it back into the confines of the rising channel.
All the major moving averages were trailing the price and provided areas of strong support on the downside. Increased buying from these levels could push the price of the flagship cryptocurrency above the middle boundary of the channel at $72,500.
Higher than that, bulls will be bolstered to push the price toward the all-time high of $73,835 or higher toward the optimistic target of the governing chart pattern at $75,250. This would represent an 8% uptick from the current price.
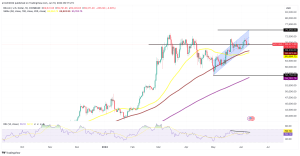

BTC/USD daily chart. Source: TradingView
On the downside, the bearish divergence from the relative strength index (RSI) suggested that the bears had not given up on pulling BTC lower. The price was trading at the lower boundary of the prevailing chart pattern around $69,230.
Losing this support would spell doom for the pioneer cryptocurrency which will fall to seek solace from the $65,580 to $66,690 demand zone, where 100-day and 50-day simple moving averages (SMAs) appear to converge.
Other lines of defense will emerge from the psychological levels at $65,000 and $60,000, respectively.


