


Last week was painful for crypto market participants. The Bitcoin price fell below the $58,000 mark, losing key support from the 200-day exponential moving average.
Although the price attempted a recovery on Saturday, July 6, the price of the big crypto dropped below the $56,500 mark again on Sunday, disrupting market structure and signaling a bearish outlook.
Ether (ETH), XRP and other top-cap cryptocurrencies slipped below critical support levels, indicating a possible downtrend for the crypto market in the days ahead.
At the time of writing, the total crypto market capitalization was at $2.05 trillion, down 3.3% over the last 24 hours. The total trading volume had jumped by 21% to $67 billion, asserting the intensity of the sell-side pressure.
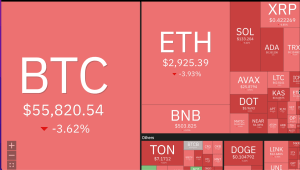

24-hour performance of top cap cryptocurrencies. Source: Coin360
Bitcoin’s price was down 3.62% over the last, while Ether lost 3.93% over the same period.
This drawdown has led to massive liquidations across the crypto market over the last week. At the time of publication, more than $79.22 long positions had been liquidated across the crypto market, and more than $50 million long Bitcoin positions have been liquidated over the last 24 hours.
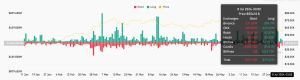

Total crypto market liquidations. Source: Coinglass
High long liquidations mean that the traders do not have sufficient funds to keep their long positions open, showing a lack of confidence in the possibility of a recovery in the near term.
As such, if the sell-side pressure continues, Bitcoin may continue dropping, pulling down the rest of the crypto market with it.
Bitcoin price analysis
Bitcoin price encountered resistance from the 200-day EMA barrier at $58,176 on Saturday, resulting in a 4% decline the next day. By Sunday’s close, it had fallen below the May 1 swing low of $56,500 and traded around $55,679 on July 8.
The RSI was at 30 in the oversold region, suggesting that the bears were controlling the price. These sellers could send the price below Friday’s swing low of $53,412. Losing this support would suggest the buyers’ inability to defend this level.
The price may drop, first toward the $50,000 psychological level and later to the support level of $41,927. Such a move would represent a 25% drawdown from the current price.
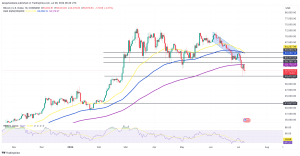

BTC/USD daily chart. Source: TradingView
On the upside, if BTC closes above the 200-day EMAl and forms a higher high in the daily time frame, it could indicate that bullish sentiment persists. Such a development may trigger the pioneer cryptocurrency to rise above the lower boundary of the declining channel at $59,198 to tag the middle boundary at $61,100.
Above that, BTC bulls may push the price to confront the resistance at $63,068, embraced by the upper boundary of the channel, the 100-day EMA and the 500-day EMA.


