


Bitcoin (BTC), the leading cryptocurrency, has been experiencing a slight decline in the last 24 hours, currently trading at $68,538.09, marking a 0.63% decrease. The market cap has slightly retracted to approximately $1.35 trillion, reflecting a cautious sentiment among investors. Despite the downward trend, the 24-hour trading volume has surged by 32.57% to $19.24 billion, indicating active trading within the market.
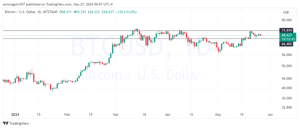

BTC’s price has oscillated between $68,308 and $69,340 today, showing a consolidation pattern as traders and investors evaluate their next moves. This comes at a time when the broader crypto market is displaying mixed signals, influencing Bitcoin’s ability to sustain higher price levels.
BTC Medium and Long-Term Technical Analysis
In a broader view, the 4-hour chart displays a bearish pattern with the creation of lower highs and lower lows. This trend highlights a key resistance near $70,649, with foundational support found at $66,343. The struggle to breach the $69,000 mark reinforces this resistance as a significant barrier. Additionally, higher trading volumes during price declines suggest that bearish sentiment may be prevailing in this timeframe.
The daily chart offers a slightly more optimistic outlook, showing Bitcoin’s recovery from lows around $56,500. However, the price encounters stiff resistance near $71,000. This critical level, if surpassed, could catalyze further upward movements, potentially challenging the next major resistance at $71,958. Volume indicators on this timeframe signal strong buying interest during rallies, although recent sell-offs have introduced increased selling pressure.
Bitcoin Oscillator Insights and Moving Averages
Mixed signals are evident from various technical oscillators. The Relative Strength Index (RSI) sits at 57, indicating a neutral market without extreme conditions of overbought or oversold. The Stochastic Oscillator at 71 further supports this neutrality. Meanwhile, the Commodity Channel Index (CCI) and the Awesome Oscillator also present neutral readings, suggesting a lack of clear market direction.
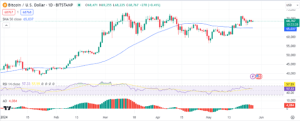

Conversely, the Moving Average Convergence Divergence (MACD) shows a bullish crossover, which could hint at underlying bullish sentiments amidst prevailing market volatility. The moving averages across different periods — particularly the bullish cross seen in the short-term 10-period EMA and the 20-period SMA — lend some support to potential upward movement.
Market sentiment currently exhibits caution, influenced by broader economic indicators and sector-specific developments. The ongoing consolidation below significant resistance levels may serve as a precursor to either a breakout or a continued downtrend, depending on forthcoming market catalysts and investor sentiment.
- Bull Scenario: Bitcoin could capitalize on the bullish signals from moving averages and MACD to break above the $69,500 resistance. Successfully holding above this level could invite further buying, targeting the $71,000 resistance next.
- Bear Scenario: If Bitcoin fails to sustain current levels and falls below the $68,136 support, it could trigger a sharper decline towards $66,343. This would confirm the bearish trends observed on shorter timeframes and could lead to increased sell-off pressures.
As Bitcoin continues to trade within this critical range, both traders and long-term investors should monitor these levels closely, prepared for potential volatility spurred by global economic shifts or crypto-specific news developments.


