


Bitcoin’s BTC rose back above the $65,000 mark during the early Asian trading hours on June 20. At the time of writing, Bitcoin exchanged hands at $66,007, up 0.7% over the last 24 hours.
This performance has reduced Bitcoin’s dominance to 52.91% of the total crypto market value with a market capitalization of $1.296 trillion.
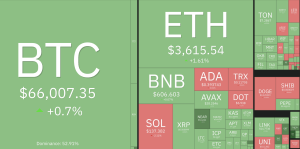

Cryptocurrency performance June 20. Source: Coin360
With a breakout, a retest, and a bullish pattern in the pipeline, Bitcoin is preparing for a massive move upward toward the end of June. Amid the rising anticipations of the impacts of spot Bitcoin ETFs and the expected launch of spot Ethereum ETFs, the big crypto is expected to scale higher.
Bitcoin’s recovery could be delayed by a slow-down in spot BTC ETF inflows which has seen net negative flows over the last two weeks, according to data from Farside Investors.
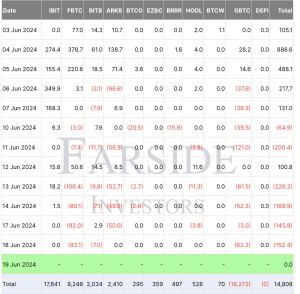

Spot Bitcoin ETF flows table. Source: Farside Investors
Despite this, the market setup shows that the BTC price could be gearing up for a sustained recovery.
Bitcoin price analysis
The BTC price is nurturing a V-shaped recovery chart pattern on the daily chart, as shown below. The appearance of a green engulfing candlestick daily chart shows that bulls are taking control of the price.
The 200-day exponential moving average (EMA) at $64,316 is acting as immediate support for the pioneer cryptocurrency.
The relative strength index (RSI) is rising toward the 50-point mark, suggesting that the buyers were returning to the scene. As such, increased buying from the current levels will see the price rise to confront resistance from the 100-day EMA at $66,732 and later the 50-day EMA at $67,088.
Higher than that, the price of the pioneer cryptocurrency could rise to hit the neckline of the prevailing chart pattern at $70,000. A daily candlestick close above this level would confirm the continuation of the uptrend with the next logical move being to the all-time high at $73,835 or the much-coveted $75,000 level. Such a move would bring the total gains to 13%.
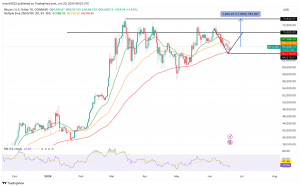

daily chart. Source: TradingView
On the downside, sellers may win the ongoing battle causing the price to turn down from the current levels. If this happens, the 200-day exponential moving average at $64,316 would provide the first line of defense. Losing this support would see BTC drop to the chart’s bottom at $60,000 or lower to the $60,000 major support level.


