


Bitcoin (BTC) continues to dominate the cryptocurrency market, currently priced at $57,178.19. The market cap stands at a robust $1.128 trillion, securing its position as the leading cryptocurrency. Despite a slight recovery, BTC has shown a consistent downtrend over recent weeks.The 24-hour trading volume stands at $40.44 billion, reflecting a decrease of 7.93%. Despite recent gains, Bitcoin struggles to sustain its upward momentum due to heightened selling activity in perpetual markets and a long-squeeze event.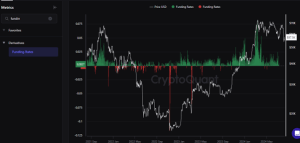

CryptoQuant’s funding rates chart shows a sharp decline, indicating aggressive short selling and the liquidation of long positions. With funding rates now negative, the market reflects bearish sentiment and short-seller dominance. Short traders are willing to pay long traders, suggesting a continued bearish outlook for Bitcoin.
Bitcoin Oscillates Near Key Resistance Levels Amidst Market Volatility
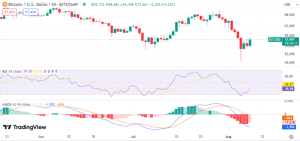
The daily candlestick chart reveals a clear downtrend. Recent candlesticks show long wicks, indicating market indecision and volatility. The price is struggling to sustain above the $57,000 mark, with strong resistance levels at $57,685 and $58,064.

The RSI for BTC is currently at 41.01, which is below the neutral 50 level, suggesting that the market is closer to being oversold than overbought. A lower RSI typically indicates bearish momentum but also highlights a potential for price reversal if the market sentiment changes.
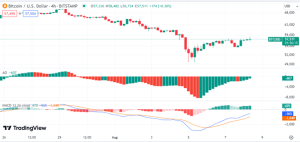
The MACD indicator shows a bearish crossover with the MACD line below the signal line. The histogram is in the negative territory, which further confirms the bearish trend. However, the decreasing size of the negative bars suggests that the bearish momentum might be slowing down.
The AO indicator shows a series of red bars, indicating bearish momentum. However, the bars are gradually decreasing in size, which could be an early sign of a trend reversal if this pattern continues.

The immediate support level for BTC is around $54,748. This level has been tested multiple times and has held strong, suggesting that it is a significant support zone.
Recent data suggests there has been a noticeable outflow of BTC from exchanges which implies holders may be moving their assets into cold storage in anticipation of further price declines. Additionally, Bitcoin futures open interest decreased by 13.18% indicating less speculative trading.
Future Outlook and Predictions
Short-Term Forecast: In order to gain any potential bullish momentum in the short term, BTC must break above $57,685 resistance level. If it fails to do so then we might see another test of $54,748 support again. If the latter breaks, attention will shift to $53k being a likely next support zone to monitor.
Mid-Term Predictions: To make sure that Bitcoin’s recovery holds and does not lessen in strength over time; it needs to close above both $58k and $59k resistance levels.A bullish crossover between RSI and MACD would confirm bearish momentum change.If these criteria are met then prices could target mid-term aim at $60k per coin.
Long-Term Outlook: Strong fundamentals and growing institutional interest continue to underpin bullish prospects for Bitcoin.However,the long-term bearish trend needs reversing before making way for substantial gains.Key on-chain metrics alongside watching key support/resistance zones will help predict where Bitcoin can go over time.


