


Bitcoin price analysis for today shows a subtle uptick in value as its price climbs back to $66,257.75, with a modest 24-hour increase of 0.12%. This slight rise comes amidst a backdrop of fluctuating market conditions and technical setups that suggest potential further gains. Specifically, Bitcoin has been oscillating around critical support and resistance points, with recent price action testing the upper limits of this range.
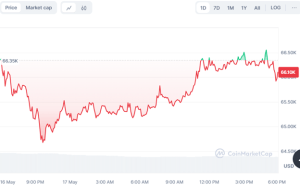

Bitcoin (BTC) is currently priced at $66,257.75, showing a slight uptick of 0.12% in the last 24 hours. The trading volume over the past day has been substantial, totaling approximately $31.39 billion, reflecting active market participation. Bitcoin’s price has demonstrated resilience, bouncing above $66,000 after a brief dip, suggesting strong buying interest near this level.
BTC faces immediate resistance at the $67,000 to $69,000 range. Overcoming this zone is crucial as it could transform it into a support area, thereby reinforcing the bullish sentiment. On the downside, support is found within the $64,580 to $63,095 range, known as the ‘imbalance zone,’ where significant buying could emerge, offering a robust accumulation point.
Bitcoin Price Analysis on the 4-Hour Chart Shows a Tug-of-War Between Bulls and Bears
Currently, the Bitcoin price on the 4-hour chart is exhibiting a relatively stable pattern with minor fluctuations, reflecting a balanced battle between supply and demand. Bitcoin trades above $65, showing a slight decrease of 0.44% in the recent period. The price action from the last few days indicates that Bitcoin is attempting to maintain momentum above the $65,000 mark, navigating through critical Fibonacci retracement levels.
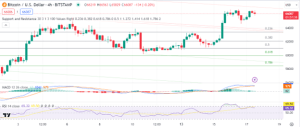

The Fibonacci retracement levels drawn from recent high and low points indicate significant interaction around the 0.236 level at approximately $64,000, which Bitcoin has successfully surpassed, now testing the region between the 0.236 and 0.382 levels. This zone acts as a pivotal area for determining Bitcoin’s short-term directional bias.
The Moving Average Convergence Divergence (MACD) indicator shows a narrow margin between the MACD line and the signal line, indicating a lack of strong momentum in either direction. This close proximity suggests a consolidation phase might be underway. Furthermore, the MACD histogram is close to the baseline, which supports the observation of a stabilizing trend without significant bullish or bearish momentum.
The Relative Strength Index (RSI) is currently at 63.59, which is slightly below the overbought territory but still denotes stronger buying activity than selling. The RSI’s position above the midline (50) supports a cautiously optimistic outlook for bulls, as it suggests that there is still some buying pressure in the market.
Looking at market dynamics, Bitcoin has managed to hold above the $65,000 support level, which is a positive sign for market sentiment. However, traders and investors should watch for the ability of Bitcoin to break past the $67,000 resistance level. Overcoming this resistance could open the path toward the $69,000 zone, potentially reinstating a more decisive bullish trend. Conversely, failure to hold current levels could see Bitcoin retest lower support levels, particularly around the 0.5 Fibonacci retracement level near $62,000.
While Bitcoin’s current trajectory seems promising, significant hurdles lie ahead. The $70,000 mark remains a critical horizontal barrier, and the downtrend line from the recent all-time high at $73,949 adds another layer of resistance. Overcoming these levels would be a definitive bullish signal, potentially setting BTC up for a run towards $80,000. However, traders should remain vigilant as shifts in market dynamics could lead to increased volatility or a reversal.


