


The Bitcoin (BTC) price has made a strong recovery, breaking out of its June downtrend and setting itself up for potential gains. This comes after the cryptocurrency formed a new higher low on the weekly chart, typically seen as a very bullish signal. After a tough April post-halving in which it lost 50% of its mining rewards, Bitcoin has been showing signs of life again with recent movement suggesting that $63k is a solid base.
July saw Bitcoin begin by printing a daily close above $63k, flipping what had become resistance into support. Most notably though, this level was defended on significant volume and marked by an increase in spot Bitcoin ETF inflows, over $129m came in on July 1st alone – the largest in three weeks.
Bitcoin to Hit New Heights: Bull Flag Formation Signals Upcoming Price Surge
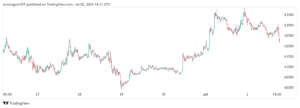
According to Rekt Capital (@rektcapital), Bitcoin could be creating a macro bull flag pattern. As shown below, this is where price consolidates upwards within a channel before ultimately breaking out again to continue pumping in price.
This is the largest inflow for the past three weeks. This suggests growing investor confidence towards Bitcoin as it starts to bounce back from lows.
This pattern represents consolidation before another large move higher for an asset – hence why it’s called a continuation pattern.

The consolidation between $59k-$72k following post-halving price action aligns with previous cycle highs and lows It’s also being supported/reinforced by on-chain data metrics like Exchange Supply Ratio (ESR) and SOPR. Both hint that we’re still within this broader ‘accumulation’ phase before BTC breaks above its current high of $64.8k and advances further upwards towards even higher highs.
Other Bitcoin analysts have also noted growing investor confidence in the cryptocurrency, with strong performances from spot Bitcoin ETFs. Eric Balchunas of Bloomberg referenced the figures in a tweet earlier today, noting that despite recent underperformance compared to mining stocks (and broader market conditions), Bitcoin ETFs have seen uninterrupted positive net flows.
Bitcoin Hovers Near Key Support Levels as Market Eyes Potential Bullish Reversal
Bitcoin (BTC) daily chart analysis signals a potential trend reversal as price action approaches key technical levels. Since the last halving event, BTC has experienced consolidation phases with some showing signs of recovery recently. BTC is currently trading around $62,569 after a dip below this level earlier today. RSI is at 43.39; indicating neither overbought nor oversold and therefore could see further upside without immediate pressure from sell-offs.
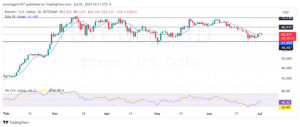

BTC is now trading above its 9-day Simple Moving Average (SMA), which acts as short-term bullish signal support – currently at $61,526. However, immediate resistance lies near $66,513 level; if broken, it could open a path towards retesting higher resistance at around $72,230 earlier this year. Conversely, should momentum fail support lies at $61,526 then lower at $58,507 – below here would reinforce bearish sentiment and likely lead to further downside.
Although the year 2024 has had a good beginning, Bitcoin’s performance has been less impressive than that of other cryptocurrencies like Hut 8 and Bitfarms, which have surged up by 86% and 34%. The reason for this is mainly seen as bigger miners’ efficiency in operations and scaling after halving.


