


Bitcoin (BTC), the world’s largest cryptocurrency by market capitalization, has been trading in a narrow range over the past week, with its price hovering around $67,797.65 as of writing today April 6th, 2024. The flagship digital asset has seen a modest gain of 1.29% over the past 24 hours, according to data from CoinmarketCap.
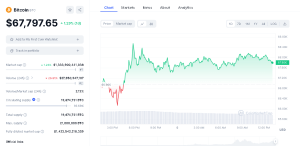

BTC Data Chart (CoinMarketCap)
Bitcoin’s market dominance remains firm, in command with over $1.3 trillion in total market capitalization, solidifying its position as the number one cryptocurrency. The 24-hour trading volume stands at $27.9 billion, a drop by 26% but this is normal on weekends as trading volumes drop. However, BTC ranks second in the crypto space in trading volume.
The cryptos circulating supply currently sits at 19,674,731 BTC, representing 93.69% of the total supply of 21,000,000 BTC.
BTC Weekly Analysis- Potential Accumulation Zone
A closer look at Bitcoin’s price action on the weekly chart reveals a bearish sentiment, with the cryptocurrency trading within an imbalance zone stretching from $59,220 to $53,002. Technical analysts view this range as an ideal accumulation zone for investors looking to increase their BTC holdings. Should a correction unfold, the next logical support zone would be around the aforementioned weekly imbalance, potentially presenting a buying opportunity for traders.
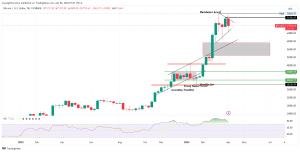

BTCUSD Price Chart (TradingView)
Some analysts speculate that Bitcoin’s price could revisit levels below $60,000 to clear trendline liquidity and fill the Fair Value Gap before potentially staging a rally towards the recent all-time high of $73,835. Historical precedent suggests that pre-halving dips, referring to price corrections leading up to Bitcoin’s quadrennial supply rate reduction event, are common occurrences and should not come as a surprise to market participants.
Daily Chart: Lack of Directional Bias
Shifting the focus to Bitcoin’s daily chart, BTC appears to be lacking a clear directional bias, consolidating between the current all-time high and the $60,771 level. A sweep of the all-time high at $73,835, followed by a rejection, could further confirm a potential reversal in the short term.
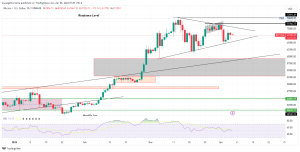
BTCUSD Daily Chart (TradingView)
On the other hand, increased buying pressure above current levels could signal a continuation of the primary uptrend. Confirmation of this scenario would come in the form of a candlestick close above $69,000, potentially paving the way for Bitcoin to reclaim the $73,835 level or even push towards the psychological $75,000 mark.
As the highly anticipated Bitcoin halving event draws nearer, market analysts suggest that the best investors can hope for during the pre-halving rally phase are shallow “buy the dip” opportunities within an otherwise steady uptrend.
The -14% dip is over
The $BTC Pre-Halving Rally has resumed (light blue)
And after that – one last PreHalving Retrace (dark blue circle)#Crypto #Bitcoin https://t.co/6hSTL1WiUl pic.twitter.com/Q8XOrCES8j
— Rekt Capital (@rektcapital) March 8, 2024
One analyst predicted that Bitcoin’s pre-halving rally had resumed at the beginning of March, followed by one last pre-halving retracement which we are yet to witness in these final days before halving. This prediction aligns with the fair value gap or imbalance retracement levels observed in the technical analysis of Bitcoin’s price charts.


