


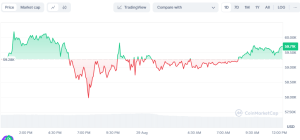
Bitcoin (BTC) has experienced wild volatility over the last 24 hours. Starting the day at around $59,300, the digital asset began to climb significantly early into the trading sessions, hitting highs close to $59,660.
This early move enabled traders to develop a positive sentiment and drive the price during the early hours. However, the upward move could not be prolonged, with the digital asset meeting resistance close to the day high that forced a reversal in Bitcoin’s price action.

Source: CoinMarketCap
A steep fall was noticed during the mid-hours of the day, and Bitcoin touched a low of around $58,500. This essentially implied that investors who had made money during the day were selling or booking profits. With a steep slide, Bitcoin steadied itself to trade at $59,000 before gradually building up recovery momentum through the rest of the trading session.
Market Sentiment and Volume Analysis
Notably, Bitcoin’s trading volume for the day declined by 18.92% compared to the previous 24 hours. This decline should point to a slackened level of participation from the traders’ end, one factor that might have resulted in the volatility mentioned above. Bitcoin’s market capitalization inched up by 0.69% to nearly $1.18 trillion.
That increase in market cap, along with the price recovery over the day, indicates the underlying sentiment being cautiously optimistic toward the broader market.
With this price action, crypto analysts have started rethinking their outlook for Bitcoin. Some even hinted at the possibility of the recent downturn simply being a hiccup in an overall bullish trend, rather than the onset of a prolonged downtrend. Technical indicators show that the day’s high of $59,660 will likely become a short-term resistance level while $58,500 should prove to be a strong support in the near future.
Technical Indicators Suggest Potential Rally
The technicals indicate a number of indicators/patterns that portend Bitcoin may take a big upswing. One analyst, Javon Marks, said that a bullish pattern has formed on Bitcoin’s near-term chart, which could signal a move back toward $65,000. He also notes a larger bullish setup that might draw the price of Bitcoin by over 21%, ideally towards $73,000. These are formed via drawing from historical price movements and technical indicators, suggesting that the most recent dip may be the result of a grander bullish setup.
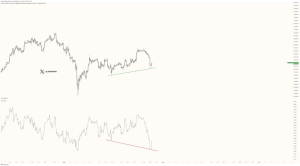

Source: X
Other analysts, like Moustache, for instance, have compared the current market to how Bitcoin behaved during the COVID-19 crash of 2020. They note that the current price action indeed looks very similar to what was seen during that period, which led to a powerful recovery. This further supports the view that Bitcoin could be on the verge of a strong rebound.
As Bitcoin consolidates around $59,000, traders are eyeing resistance levels at $60,500. A break above this level may trigger a more substantial recovery, taking the price toward the $61,500 resistance. On the downside, if Bitcoin fails to clear the resistance at $61,500, there could be a bearish reaction. In this scenario, the price is likely to test $58,500 and $58,000 support levels.


