


The price of Bitcoin has continued to experience selling pressure, and this has seen it trade below the 50-DMA. At the time of writing, Bitcoin (BTC) is at $65,685, 5% down from the previous week on the weekly chart.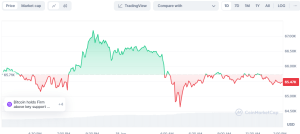

Bitcoin market capitalization fell below $1.3 trillion, while daily turnover increased by 125 percent to more than $35.7 billion. This decline occurs as spot Bitcoin ETFs see large outflows, suggesting that institutions are losing interest.
Price Clusters Suggest Further Downside
Citing the price clusters that appear at $71,600, popular crypto analyst Rekt Capital says more downside is expected.
In a June 17 post, Rekt Capital observed that such clusters usually occur before price action moves to the lower part of the range.
Bitcoin traded as high as $71,949 on June 7 before tumbling to the present rate. This could suggest that BTC prices will likely remain near round numbers before a deep correction occurs and Bitcoin can resume its rise.
Technical Indicators Point to Lower Levels
Technical analysis shows that more downs may be expected before Bitcoin begins a strong uptrend. A technical formation on the monthly chart noted by Titan of Crypto indicates that Bitcoin may drop below $60K. He said the indicator is more relevant the higher the timeframe, with $58,800 being a level to watch by July 1.

The Relative Strength Index (RSI), a momentum indicator, was at 41 on June 17 to show that Bitcoin is fairly valued. Nevertheless, during the last major correction on May 1, the RSI reached 33 when Bitcoin’s price fell to $56,600 before continuing its upward movement.
This means that the price of Bitcoin might have to come down a bit more before the next run up can be expected.
Liquidation Levels and Support Zones
Coinglass data reveal that Bitcoin has a strong buy level at $64,500, and if the price drops below this level, the long-leveraged traders may liquidate for more than $520 million.
Furthermore, according to CryptoQuant data, the cost basis for short-term holders (STHs) is approximately $62,200, which is another possible support level. The realized price for STHs, entities holding BTC for up to 155 days, could be the next significant level of support for the Bitcoin price.
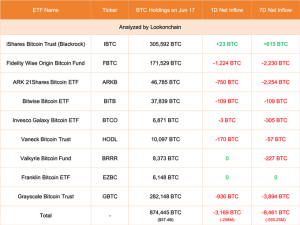
Current Bitcoin price pullbacks are associated with large redemptions of spot Bitcoin ETFs. These ETFs witnessed outflows of over $200 million on 17th June alone, adding to the selling pressure. Fidelity’s FBTC and Grayscale’s GBTC were among the ETFs that saw noteworthy outflows of $80 million and $60 million, respectively.

The continued outflows indicate dwindling institutional interest and have compounded the bearish sentiment in the market. The further indication by the Federal Reserve on higher interest rates for a longer time has also played a significant role in the market decline.
Analysts’ Projections and Potential Scenarios
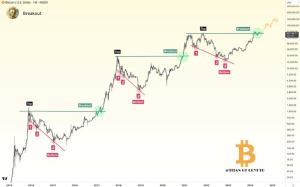
Bitcoin could potentially correct below $64,000 to initiate a healthy reset before entering the bull cycle’s parabolic phase, as analysts such as Rekt Capital suggested. Historical price patterns indicate that resistance is found at progressively lower levels when Bitcoin fails to break through the range high of $71,350.
When Bitcoin forms clusters of price action near the Range High resistance at ~$71600…
These precede downside into lower levels of the range$BTC #Crypto #Bitcoin pic.twitter.com/q6KtxPIvjS
— Rekt Capital (@rektcapital) June 17, 2024
However, analysts consider the support levels to be the only barrier between the cryptocurrency and a drop to $63,800.
Rekt Capital stated that since Bitcoin failed to break lower highs like the $67 200, it reveals the weakening of support. If Bitcoin fails to close above these levels, it is likely to depict further downward movement.


