


In the last week, Bitcoin (BTC) experienced a stunning price movement with a peak at about $69,000 before correcting itself. The data available as of this moment indicates that BTC is now going for $66,032.21, which is 0.55% down over the past seven days.
The volume of trade for Bitcoin has dropped significantly by 28.08%, indicating reduced market activities and possibly leading to the fluctuations in prices witnessed during the week. This decrease in volume usually suggests a loss of trader’s interest or lack of certainty concerning the direction of prices among investors.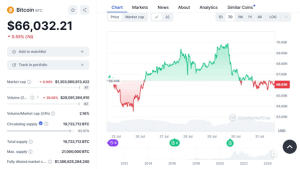

BTC/USD 7-day Price Chart(Source: CoinMarketCap)
Also, the market capitalization of Bitcoin has dropped by about 0.94%, which demonstrates a recent decrease in the market capitalization of the asset. This decline in market cap coupled with low trading volume gives the impression that recent price changes might be indicating a higher level of investor caution.
BTC/USD Technical Analysis
Based on the technical analysis, the 4-hour Moving Average Convergence Divergence shows the MACD line is currently bearish since the blue line has crossed the orange line in a downward trend. The MACD values at the moment are at -142 which means that the bearish pressure is increasing, therefore more pressure is being applied on the price to fall.
Analyzing the histogram which is the difference between the MACD and the signal line, the histogram has been predominantly in the red, which means that the market is bearish. However, there is a clear change in the histogram color that depicts the declining sell pressure. This can be thought of as the early stages of consolidation or as a bull reversal setup.
Moving to the Bull Bear Power (BBP) indicator for Bitcoin, the recent 4-hour chart depicts a clear trend. These BBP values have mostly been negative and the latest one is at -1,031. This shows that the bears have been in charge and as a result, have been depressing the price of Bitcoin for the past few days.
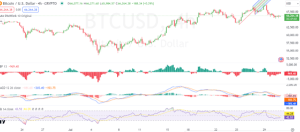

BTC/USD 4-Hour Price Chart (Source: TradingView)
The BBP bars also show negative values that have recently touched the lows of -2,000, which is at the time of a steep price drop. This pattern further supports that bears are in control, in line with the current trend in the price action. However, the recent diminishing of the intensity of red bars shows that the market is slowly changing its sentiment.
Currently, RSI is at 44.06, which means that Bitcoin is neither overbought nor oversold, thus making it quite neutral. This level implies that the market forces of demand and supply are fairly equal and neither the buyer nor the seller is dominating the price action.
However, in the most recent period of RSI progressions, it has gradually decreased from the 50s area to the mid-40s presently. This fall is in line with the general decline in the prices of digital assets recently, which shows that there is pressure to sell or the buying momentum is weakening. Nevertheless, the RSI is not below 30 and hence there is no sign of any panic or selling spree at the moment.
However, if the RSI stays and moves further down towards the oversold zone, this may suggest some form of consolidation or a mild bearish direction.


