


The Bitcoin market is experiencing a noticeable downturn, with the price fluctuating near the $67,881 mark, reflecting a mild daily decline of 0.50%. Despite this, the trading volume has seen a significant uptick by 10.84% to $28.57 billion, indicating an increase in market activity which may be driven by traders reacting to the latest market news or price adjustments.
Today’s trading session sees Bitcoin grappling with key resistance levels as it attempts to stabilize after recent drops. The market cap has slightly decreased by 0.45% to $1.34 trillion, suggesting some level of sell-off occurring in the market. The recent price movement has Bitcoin trading just below the crucial $68,000 threshold, which has historically acted as both support and resistance for the cryptocurrency.
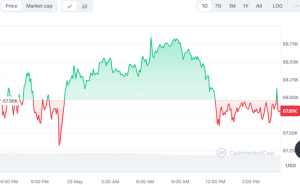

The chart indicates that Bitcoin faced a peak near $68,750 earlier in the day before encountering a sharp pullback to its current levels, hinting at a potential resistance that traders struggle to overcome. The volume-to-market cap ratio stands at 2.14%, which suggests that despite the higher volume, the overall market cap hasn’t kept pace, pointing towards a bearish sentiment in the short term.
Bitcoin Stabilizes Near $67,700, Navigating a Narrow Range
Today’s trading session has Bitcoin navigating a narrow range, stabilizing the cryptocurrency near the $67,700 mark. The chart demonstrates a consolidation phase where Bitcoin fluctuates slightly below the $68,000 resistance level, struggling to reclaim higher ground. This behavior indicates a cautious market sentiment, as traders and investors are weighing recent developments and economic indicators before making significant moves.
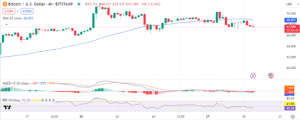

The 4-hour chart showcases Bitcoin’s attempts to stabilize above the $67,500 support after a recent dip. The Simple Moving Average (SMA) for 50 periods is set slightly above the current price at $68,853, suggesting that this could be a potential resistance in near-term trading sessions.
The Moving Average Convergence Divergence (MACD) is trending below the baseline, indicating bearish momentum, while the Relative Strength Index (RSI) hovers just below the neutral 50 mark, reflecting a balance between buying and selling pressures.
Technical indicators suggest a critical juncture for Bitcoin. If the price can breach the $68,000 mark, it could pave the way for a test of higher resistance levels. Conversely, failure to maintain support at $67,500 could lead to further declines, potentially testing the resilience of the $67,000 support zone.


