


The cryptocurrency market has recently faced significant turbulence, highlighted by Bitcoin’s price dropping below $59,000. This movement was accompanied by massive liquidations totaling $132 million, primarily affecting long positions. Despite a brief recovery last week, Bitcoin’s price retraced, failing to maintain the critical $60,000 level, and currently hovers just above $58,000.
Bitcoin’s price dropped dramatically from an intraday high of $61,868 to a low of $58,315, reflecting a decline of over 4% within the day. The weekend’s price action was relatively stable, with BTC consolidating around the $61,000 mark before the bears pushed the price lower in the early hours of the Asian trading session. The subsequent decline continued, leading to a low of $57,700 before seeing a minor recovery. The price has currently stabilized at $58k, with fluctuations reflecting a tug-of-war between bullish recoveries and bearish pullbacks.
Bitcoin Finds Stability Above $58k as Technical Indicators Signal Continued Uncertainty
Bitcoin’s price action has been notably tumultuous, with the cryptocurrency facing stiff resistance as it attempts to reclaim higher price levels. A recent attempt to breach the $60,000 mark was met with a significant sell-off, illustrating the psychological and technical barriers at this level. The price has since oscillated around the mid-$59,000s, struggling to establish a clear directional bias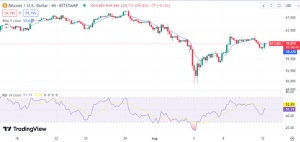

The 9-period EMA on the 4-hour chart shows that Bitcoin is grappling with this line as a dynamic resistance. Currently, the price is just hovering around the EMA, indicating a tussle between bulls aiming to push prices higher and bears pulling them down. This EMA serves as a crucial marker; consistently closing above this line might suggest a shift toward a bullish sentiment.
The RSI on the 4-hour chart hovers around the 50 mark, a neutral zone that underscores the current market indecision. A recent peak near the 55 level suggests some buying momentum, though not strong enough to push the indicator into bullish territory above 60. This suggests that while there is some latent buying interest, it is countered by equally persistent selling pressure at higher levels.
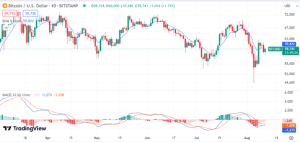
The Moving Average Convergence Divergence (MACD) shows a continuation of the bearish momentum, with the MACD line trending below the signal line, suggesting that the bearish sentiment may persist.
Bitcoin Awaits Breakout Amid Economic Data Release
Last week saw huge outflows totaling $160.10m from Bitcoin ETFs in the U.S., signaling bearish investor’s sentiment. On-chain data seems to second this view with indicators pointing south for BTC. The combined reserves for spot bitcoin held by all US-based Bitcoin ETFs now stand at $48.81billion, a decrease from previous levels, indicating increased caution among investors.
Going forward, there is potential volatility in Bitcoin markets especially following PPI and CPI inflation releases by US Government on Tuesday and Wednesday respectively. Volatility could be high around this time though no major surprises are expected that could exacerbate the current market downtrend. Technical indicators and market dynamics suggest that it may not be easy for bitcoin to reclaim $60k level in near future thus further consolidation or dip under $58k is probable here.


