


According to the Bitcoin price analysis today, BTC fell by almost 2.05% on Sunday, the overall market sentiment remains bearish. This affected all the other cryptocurrency markets, with the Bitcoin price dropping to around $68,500 from $71,333 and then stabilizing at around $69,300
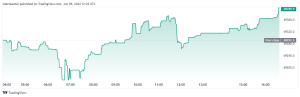

BTC/USD 24hr Price Chart( Source: CoinMarketCap)
With such considerable declines in Bitcoin prices, this formed a bearish trend affecting the market predominantly, where all altcoins showed double-digit losses. This has left traders in a dilemma, debating on buying the dip or waiting longer for another selloff.
Bitcoin trades near $69,332.49 and has just tagged a multi-month peak close to $71,911 with a shallow touch under the 0.236 Fib level at $69,614.33. Severe sell pressure is seen around higher retracement levels as Bitcoin struggles to sustain its upward movement past these points. Support areas found around $67,810.98 (0.382), $66,544.35 (0.5), and $65,277.71 (0.618).
BTC Slips Below the $70k handle
In the last 24 hours, Bitcoin has thus far shown price action which first saw it drop below a crucial psychological level and then rise to a point where it could regain losses it had therefore massively printed. After spending just more than a month since reaching a high of $71,333, Bitcoin crashed below $70,000—more precisely, around $68,500—before bouncing back just below $69,500. In this second stabilization phase, a cooling-off period would occur, in which investors go back to revisit their positions, and the market may find further direction. The current trading price is around $69,300, representing cautious sentiment as the market digests the midweek’s volatility.
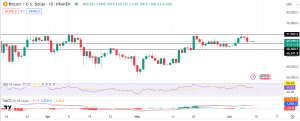

Bitcoin’s recent price action underscores the prevailing bearish sentiment in the market. The sharp drop and follow-up merely underline the indecision and caution traders were approaching the market with. RSI and MACD technical indicators show a bearish sentiment, with possible further downsides in the near term, should critical support levels be breached.
Relative Strength in the Index stands at 56.31, marginally above the neutral value of 50, indicating modest bullish bias but, more importantly, decreasing from the previous peaks, which suggests a slowdown in buying momentum. The fact that the MACD line is under its trigger line gives a bearish signal. The greater spread between the lines and dominance of the red bars in the histogram confirms a stronger signal of the continuation of the bearish tendency.


