


Bitcoin BTC is still in a state of indecision, with both the bearish and bullish indicators being seen in the market. According to the last update, BTC remains at $67,728.0 with a slight uptrend of 0. 71% in the past day, and the 24-hour trading volume is $105. 98 billion and a market capitalization of $1. 35 trillion.
This slight increase is after experiencing a fluctuating trend whereby Bitcoin dipped to as low as $67,689.5, which shows that the cryptocurrency still faces challenges in maintaining the highs that it reached.
Market Reactions and Analyst Insights
This is one of the major points of debate among traders and analysts that the cryptocurrency has not been able to break the $69,000 resistance level recently. This resistance, together with other factors that include a market correction, has led to concerns on the short-term direction of Bitcoin, especially as it struggles to reclaim its all-time high of $73,835.
Over 37,000 $BTC have been withdrawn from #crypto exchanges in the past 72 hours, worth around $2.53 billion! pic.twitter.com/gQJLFAy5KY
— Ali (@ali_charts) May 31, 2024
However, such a picture is not completely accurate, as significant outflows from exchanges, exceeding 37 thousand BTC in the past three days, indicate a change in the sentiment of long-term storage. This outflow could suggest that there is less pressure on the asset to be sold on the short term, which could be good news for the bulls in the near term.
BTC Price Analysis and Technical Metrics
Technically, Bitcoin is now in a critical stage of support and resistance areas. The level at $67k has been relatively stable, and Bitcoin has recovered above this level after some dips. The resistance at $69,000 continues to be a significant hurdle that Bitcoin must breach to sustain an upward trend. The liquidation of long positions in the derivatives market, which contributed $144 million to the total in the recent period, contributes to the market’s complexity by potentially affecting short-term price movements.
Further complicating the analysis of the Bitcoin market are flows into U. S. spot Bitcoin ETFs, which have stood at $1. 96 billion since May 15, which brought the assets under management over $50 billion mark. This trend coupled with the fact that Bitcoins are being pulled out of exchanges to wallets, has led to a decrease in the market depth, which may increase price fluctuations and sensitivity to buy-side pressures.
At the same time, the macroeconomic information, including the latest U. S. GDP growth miss, added more noise, which affected investor sentiment and could potentially influence Bitcoin’s short-term performance.
Bitcoin Consolidates Near $67,700
Bitcoin price on the 4-hour chart shows that it is in a consolidation phase and remains in a range-bound movement. The current price is $67,728 with only slight variations in the price range within the past 24 hours. It is estimated to be around $68,000 and has been established to be a major hurdle that Bitcoin has failed to overcome regardless of the numerous attempts.
On the other hand, demand is identified at around $ 67500, which indicates that price drops at this level have been continuously bought, indicating a strong demand at this price level.
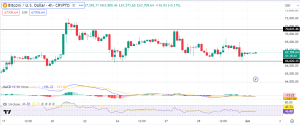

Bitcoin’s technical indicators on the 4-hour chart show a mixed market sentiment as the current MACD indicator is bearish with a bearish crossover. Therefore if the market turns bearish, the price is likely to start falling. However,(RSI) the Relative Strength Index remains at 47, which shows that there is still some space for further increase or decrease before reaching the overbought or oversold levels.


