


Bitcoin (BTC) has shown much strength in the past 24 hours by breaking out above a sizeable daily resistance level. In doing so, there was a powerful upward move on the daily chart, with Bitcoin going from around $60,800 to a peak of $61,386.78 registering a critical break over the $61,000 resistance level that had previously kept a limit on any upward gains.
Breaks are usually bullish in the market as they show increased buy-side pressure, with traders and investors repositioning for strategies matching the new momentum.
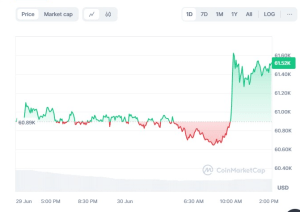

BTC/USD 24hr Price Chart (Source: CoinMarketCap)
Despite all the bullish price action, the trading volume over the same time frame has reduced significantly by around 40.47%. The decrease in volume may suggest a lack of conviction to the upside break of resistance because it is usually higher volumes that are favored for sustainability of new price levels.
The market cap has, however, shown a marginal rise, moving in with the price to $1.21 trillion approximately. Also, the volume ratio to the market cap decreased, signaling that the increase in price was not supported by proportional liquidity.
BTC/USD Technical Analysis
On the 4-hour Bitcoin chart, the Moving Average Convergence Divergence (MACD) indicator shows a relatively slight bullish signal, indicating a reversal or a slowdown of the recent downtrend.
The MACD line has just crossed above the signal line, a classic bullish crossover that suggests more upside momentum. Furthermore, the histogram plotted to show the difference between the MACD line and the signal line has just turned positive above the baseline for the first time after sustaining deep negatives. This would suggest a rising bullish momentum, complementing the strength of the crossover signal.
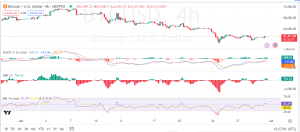

BTC/USD 4-hr Price Chart(Source: TradingView)
In contrast, the Bull Bear Power (BBP) oscillator, which measures bear versus bull strength by comparing daily lows to the 13-period exponential moving average (EMA), has continued to post mostly negative readings for BTC, meaning bears seem to have better control this time.
A recent tick higher toward the zero line suggests bearish power is weakening and may provide bulls an opportunity to take over. The decreasing bearish values of the BBP, in combination with its move toward the baseline, set up a subtle suggestion for a change in momentum.
The RSI is at 52.53, which means it’s neutral, without overbought or oversold conditions. While it might just signal that the market will soon stabilize, it could also very quickly indicate that future BTC prices will move in either direction.


