


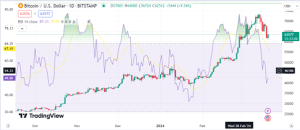
The Bitcoin market experienced a significant downturn, marked by a sharp price drop below the $63,000 threshold. This movement is part of a broader sell-off in the cryptocurrency sector, leading to a decrease in Bitcoin’s value below the $61K level. Similarly, Ethereum, the second-largest cryptocurrency by market cap, saw an 8% decline to $3,200.
This downward trend winds in the market began around March 14, following a period of bullish growth that saw the total market capitalization reach around $2.72 trillion. The initial signs of a market correction were indicated by bearish divergence signals and an overextended daily Relative Strength Index (RSI), pointing towards a potential overvaluation and diminishing trader demand.

BTC Stumbles Below Key Resistance Levels
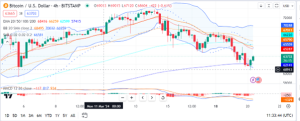
Based on the 4-hour chart analysis of Bitcoin, the cryptocurrency has had a challenging time maintaining its value. It recently hit resistance near the $65,419 mark, but was unable to sustain that level and fell sharply. This suggests that at around $65,419, sellers began to outweigh buyers, pushing the price down.
Bitcoin’s price fall brought it below several key levels that traders often look at for signals, including the Exponential Moving Averages (EMAs) for 20, 50, 100, and 200 periods, with prices like $65,298.0 (20-EMA), $66,991.9 (50-EMA), $66,169.0 (100-EMA), and $62,087.6 (200-EMA). The current price appears to be around $63,126.0, which is below these EMAs, suggesting a bearish sentiment in the market.
In terms of technical indicators, the chart shows that the Bollinger Bands (which measure market volatility and price levels) had expanded during the price drop, with the current price sitting below the 20-period Simple Moving Average (SMA) of the Bollinger Bands, located at $65,837.3.
The Parabolic SAR dots are above the price bars, which typically indicates a downtrend and might suggest it’s not yet time to expect a trend reversal. Meanwhile, the MACD indicator below the chart is showing red bars below the zero line, which tells us that the downward momentum is strong. The MACD line itself is below the signal line and below the zero level, reinforcing the bearish sentiment.

Bitcoin saw a sharp decrease recently, losing over 8% of its value and hitting a low of $60,827. This was its biggest drop in a day since the FTX exchange issue back in November 2022. Despite this, Bitcoin managed to climb back up a bit, currently sitting at $63,588.81
, though it’s still down from its record high of more than $73,000.
What’s Behind Bitcoin’s Recent Dip?
The dip seems to be the result of several things,according to Alex Kruger .The trader and market analyst based on X platform suggests that one big reason was a lot of money being pulled out of Bitcoin exchange-traded funds (ETFs). For example, ETFs in the U.S. had their biggest day of losses ever, with $326 million leaving the funds. Over-leverage in the market, Ethereum’s influence, and too much excitement around Solana’s meme coins also played a part.
Reasons for the crash, in order of importance
(for those who need them)
#1 Too much leverage (funding matters)
#2 ETH driving market south (market decided ETF not passing)
#3 Negative BTC ETF inflows (careful, data is T+1)
#4 Solana shitcoin mania (it went too far)— Alex Krüger (@krugermacro) March 20, 2024
The market is also getting ready for the Federal Reserve’s decision on interest rates. If rates go up, it could make investors cautious and pull back from riskier investments like Bitcoin. But the expectation is that rates will stay the same for now, which means there shouldn’t be a big impact on the market just yet.
Even with the recent fall, the outlook for Bitcoin is still pretty positive. New Bitcoin ETF approvals have sparked more interest, and there’s been a lot of money coming into crypto investment products. Plus, with the Bitcoin halving event coming up, which cuts the number of new Bitcoins in half, the demand could push its value up even more.
Experts say that it’s normal for markets to have corrections, like a 20% drop, especially when they’ve been growing. This suggests that Bitcoin’s current state is a normal part of its long-term upward trend. Looking back, such dips have often preceded significant rallies in Bitcoin’s price history.


