
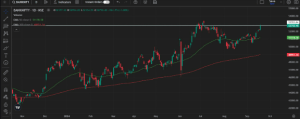
Bank Nifty, a major indicator of banking sector performance in India’s stock market, is currently at a critical resistance level, as shown in the chart. The index has been leading the broader market rally, with key banking heavyweights contributing to its upward momentum. However, as the Bank Nifty nears the resistance zone between 52,275 and 52,575, traders and investors alike are pondering whether it will break through to create a new all-time high or face a pullback.
In this analysis, we will examine the technical setup of Bank Nifty, key support and resistance levels, and potential strategies traders can adopt to navigate the uncertainty. The article will also touch on the Nifty Private Bank Index, providing a holistic view of the Indian banking sector.
Bank Nifty: Current Market Structure and Resistance Zone
Bank Nifty has experienced a significant bullish trend, marked by the recent surge in buying interest, especially in heavyweights like HDFC Bank, ICICI Bank, and State Bank of India. These key components of the index have been instrumental in driving the current uptrend. However, as the chart indicates, Bank Nifty is nearing a major resistance zone, which could act as a temporary top.
The resistance levels of 52,275 and 52,575 represent critical areas where traders should be cautious. Historically, such levels often see increased selling pressure as investors look to lock in profits. With the index reaching these levels, the likelihood of a short-term pullback has increased. Traders should closely monitor the market’s reaction as it approaches these resistance zones.
Technical Indicators: Moving Averages and Overbought Conditions
The Bank Nifty chart reveals that the index is currently trading well above its 50-day and 200-day Exponential Moving Averages (EMA), signaling a strong bullish trend. The 50-day EMA is around 51,178, while the 200-day EMA is at 48,951. These moving averages indicate that the overall momentum remains bullish, but with the index near overbought conditions, caution is warranted.
Indicators like the Relative Strength Index (RSI) also suggest that Bank Nifty may be approaching overbought territory, increasing the chances of a pullback. Historically, when the RSI crosses into overbought zones, a period of consolidation or correction often follows.
Potential Pullback Levels: Support Zones for Accumulation
If Bank Nifty fails to break through its resistance and experiences a pullback, traders should be prepared to capitalize on the opportunity by identifying key support levels. According to the chart and market analysis, the index has several key support zones where accumulation could be considered:
- 51,280: This level represents the first major support, and a pullback to this area could provide an early entry point for traders looking to accumulate.
- 50,964: The next level of support, where traders should watch for buying interest to resume.
- 50,664: This zone provides further support, offering a lower-risk entry point if the correction deepens.
- 50,225: The final key support level, where traders could look for strong buying activity as the index stabilizes.
By waiting for a pullback to these support levels, traders can minimize risk and optimize their entry points for the next bullish wave. The key strategy here is patience, allowing the index to correct before entering new long positions.
Long-Term Outlook: Bullish but with Caution
While the short-term outlook for Bank Nifty suggests the possibility of a pullback, the long-term trend remains bullish. The banking sector continues to show strong fundamentals, with improving credit growth, stable asset quality, and a recovering economy. As a result, any short-term corrections should be viewed as buying opportunities rather than a trend reversal.
However, traders must adopt a cautious approach, especially as the index approaches key resistance levels. By booking profits near the resistance and waiting for the pullback to accumulate, traders can effectively manage their risk while positioning themselves for the next upward move.
Nifty Private Bank Index: Overbought Zone and Profit Booking
The Nifty Private Bank Index, which tracks the performance of private sector banks in India, has also been experiencing a strong bullish trend, as per Business Standard. However, like Bank Nifty, it is now entering an overbought zone, signaling the potential for near-term profit booking.
Key resistance levels for the Nifty Private Bank Index are identified between 26,265 and 26,450. Traders should consider booking profits as the index approaches these levels, securing recent gains and reducing exposure to potential corrections.
On the downside, the following support levels provide attractive re-entry points after a correction:
- 25,736
- 25,550
- 25,380
- 25,000
These levels offer opportunities for traders to re-enter the market for short-term gains once the index stabilizes. By adopting a cautious approach and waiting for a correction, traders can optimize their risk-reward ratio and capitalize on the next upward move.
Trading Strategy: Booking Profits and Waiting for Pullbacks
Given the current market structure and the likelihood of a pullback, the recommended trading strategy for both Bank Nifty and the Nifty Private Bank Index is to book profits near the resistance levels and wait for a correction before accumulating positions.
For Bank Nifty, traders should closely monitor the 52,275 to 52,575 resistance zone. If the index fails to break through this zone and begins to correct, traders should look to accumulate around the 51,280, 50,964, 50,664, and 50,225 support levels. This approach minimizes risk while positioning traders for the next bullish wave.
Similarly, for the Nifty Private Bank Index, traders should book profits near 26,265 to 26,450 and wait for a pullback to the 25,736, 25,550, 25,380, and 25,000 support levels before re-entering the market.
Conclusion: Will Bank Nifty Create a New All-Time High?
The Bank Nifty index is at a crucial juncture, with the potential to either break through its resistance and create a new all-time high or face a pullback. The technical indicators suggest that the index is nearing overbought conditions, and the resistance zone between 52,275 and 52,575 could act as a near-term top.
However, the long-term outlook remains bullish, and any corrections should be viewed as buying opportunities. By following a strategy of booking profits at resistance and accumulating during pullbacks, traders can effectively manage risk and position themselves for the next upward move.
As always, patience will be key in navigating the current market conditions, and traders should remain vigilant as the Bank Nifty approaches its critical resistance levels.
