


The price of Avalanche (AVAX) has faced significant downward pressure in recent weeks, marking a steep 47.9% decline and reaching a critical support zone around $32.3. In the last 24 hours, AVAX has undergone a minor 2.5% price change, currently trading at $34.60. This places AVAX at a crucial juncture in its price prediction trajectory, with potential retesting of the $29.4 price levels looming before any anticipated upward movements materialize.
The live Avalanche trading volume of AVAX stands at $279,740,086. Despite the recent uptick, AVAX’s price action indicates a broader bearish trend in alignment with the general crypto market, which has also experienced setbacks. Bitcoin’s trade value under $64,000 and Ethereum’s position just shy of $3,200 underscore a prevailing market instability.

AVAX’s price has vacillated between $40 and $33 in the past week, reflecting a downward trajectory with a decline exceeding 3%. The altcoin has consistently struggled to hold above the $40 benchmark, succumbing to sell-off pressures. With over a 36% decrease in the past month, AVAX’s bearish sentiment is strong. If the bulls can engineer a rally past the immediate resistance at $35, we could see AVAX’s momentum pivot, setting sights on the $50 resistance level.
Avalanche (AVAX) Shows Signs of Consolidation After Recent Sell-Off
The Avalanche (AVAX) market has experienced a notable retracement, with the price currently stabilizing around $34.60. After a tumultuous sell-off that saw the digital asset drop nearly 2% to reach lows not seen since December last year, traders are now closely monitoring the AVAX/USD pair for signs of a potential recovery or further decline.
On the daily chart, AVAX has been trading below the 20 SMA, a sign that the bearish sentiment has been in control over the past few weeks. The Bollinger Bands, which measure market volatility, have begun to narrow, indicating a potential decrease in volatility and a possible consolidation phase.
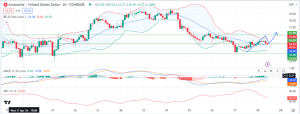

The price of AVAX is now sitting just above the lower Bollinger Band, suggesting that it is in a region where buyers might start to see value, which could lead to a rebound. The middle of the Bollinger Band, currently at $42.14, is acting as a short-term resistance level. A break above this could signal a shift in market sentiment from bearish to bullish.
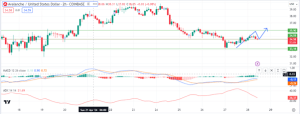
The Relative Strength Index (RSI), a momentum indicator, shows a value of 37.68, which is close to the oversold territory. This could indicate that the selling pressure might be exhausting, and there might be room for an upward movement if the buyers step in.
The Moving Average Convergence Divergence (MACD) has been trending below the signal line, confirming the bearish momentum in the market. However, the histogram shows the bars shortening, which could suggest that bearish momentum is losing strength.
For a more pronounced recovery, AVAX would need to reclaim and hold above the $38 level, which has acted as both support and resistance in the past. A sustained move above this level could encourage further buying, potentially leading to a test of the upper Bollinger Band at $48.
On the downside, if the current support level around $34 fails to hold, the next key level to watch would be the $29 area, which has historically acted as strong support. A break below this could lead to increased selling pressure and a deeper decline.


