


The Solana price is trading at $135 as of 7:30 am EST, down 0.5% over the last 24 hours.
SOL has been on an uptrend since the start of 2023 and has risen 496% over the last 12 months. It has a market capitalization of $60.57 billion and is now positioned at #5 on the CoinMarketCap ranking.
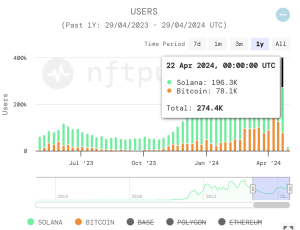
One of the reasons that makes SOL still a good buy in 2024 is the increased user activity on the layer 1 blockchain. According to data from nftpulse.org, daily active NFT users on Solana and Bitcoin have been increasing over the past four weeks.

Blockchain performance by NFT Users. Source: nftpulse.org
The chart above reveals that daily active users on Solana hit a record high of 196,300 on Apr. 22.
“The increase in trader count is driven by wallets trading at less than $10 daily on Magic Eden and Tensor,” crypto analytics newsletter OurNetwork said.
According to Solana Floor, a platform that shares insights on the Solana blockchain, Solana’s dominance in NFT users now stands at 46%
🚨 REPORT: @Solana flips every other chain, including Bitcoin and Ethereum, in Weekly NFT Blockchain Users adoption.
Dominance: 46%
Blockchain Users: 139,000 pic.twitter.com/PD127Hjbhu— SolanaFloor | Powered by Step Finance (@SolanaFloor) April 29, 2024
Solana investments funds register $4.1 million inflows last week
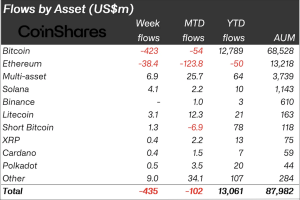
Last week marked the third consecutive week of outflows from crypto investment products as investors withdrew more than $942 million, according to an April 29 report by CoinShares.
The report noted that last week marked the “outflows for the third consecutive week totalling US$435m, marking the largest outflows since March this year.”
However, Solana was among the “regular favourites”that saw inflows of $4.1 million.

Source: CoinShares
This increase in inflows in Solana investment products attests to the confidence investors have in the token.
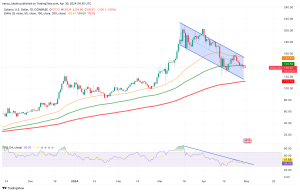
From a technical point of view, SOL is trading in an extended downtrend away from overbought conditions. The RSI is positioned at 38, painting near-oversold conditions. This shows that the ongoing downtrend may soon run out of steam giving sidelined investors an opportunity to buy more on the dips and initiate a recovery.
If this happens, SOL will turn up from the current level to produce a daily candlestick close above that 100-day Exponential Moving Average (EMA) at $139 to ward the upper boundary of the declining channel at $152, embraced by the 50-day EMA.
A rise above that would confirm breakout from this channel with the next level to watch being the $200 psychological level and later the multi-year high at $210.

SOL/USD daily chart. Source: TradingView
On the downside, failure to rise above the 100-day EMA would mean that the downtrend is not over for Solana. A drop below the channel’s middle boundary would see SOL drop to seek solace from the lower boundary of the governing chart pattern at 112, embraced by the 200-day EMA. This is where Solana’s downside could be capped in the meantime.


